
Figure 3. Correlation plot between two orthogonal gene expression methods using Giant Cell Tumor of the Bone biopsy RNAs.
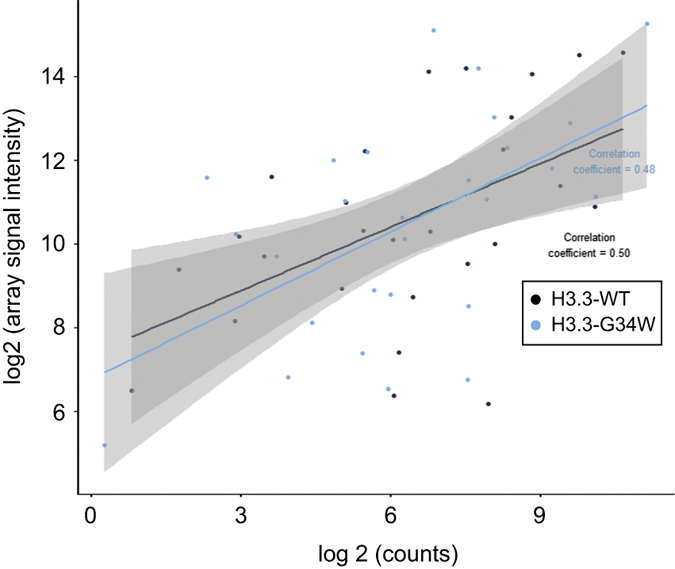
Gene expression microarray log2 signal intensity was plotted on the y-axis against data from the quantitative and hybridization-based transcript-counting nCounter technology (NanoString Tech.) on the x-axis. The Giant Cell Tumor of the Bone biopsies stem from two independent, non-overlapping samples sets. The pairwise plot indicates a strong correlation coefficient of 0.50 for H3.3WT and 0.48 for H3.3G34W.