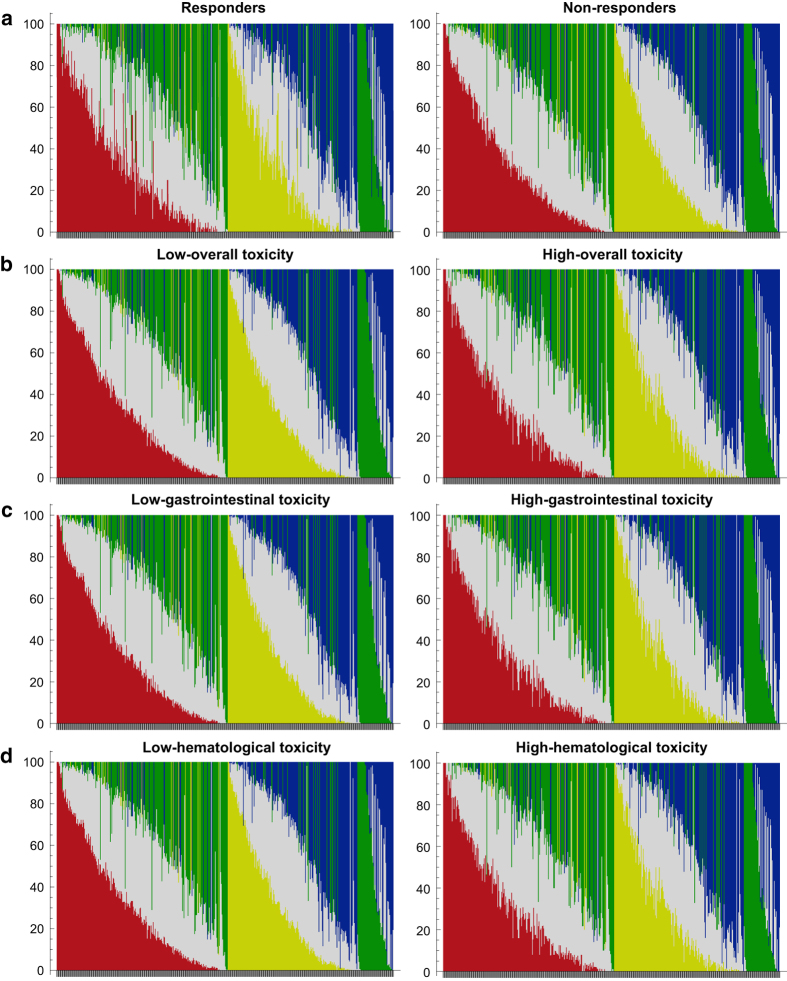
Figure 2. Landscape of genotyping in the discovery stage.
(a) The genotyping results of 504 SNPs in the discovery stage of response analysis. (b) The genotyping results of 504 SNPs in the discovery stage of overall toxicity analysis. (c) The genotyping results of 504 SNPs in the discovery stage of gastrointestinal toxicity analysis. (d) The genotyping results of 504 SNPs in the discovery stage of hematological toxicity analysis. Each bar showed the percentage distribution of genotypes for each SNP. Red, yellow, blue, green and gray referred as the homozygous of T, A, C, G and heterozygous, respectively.

