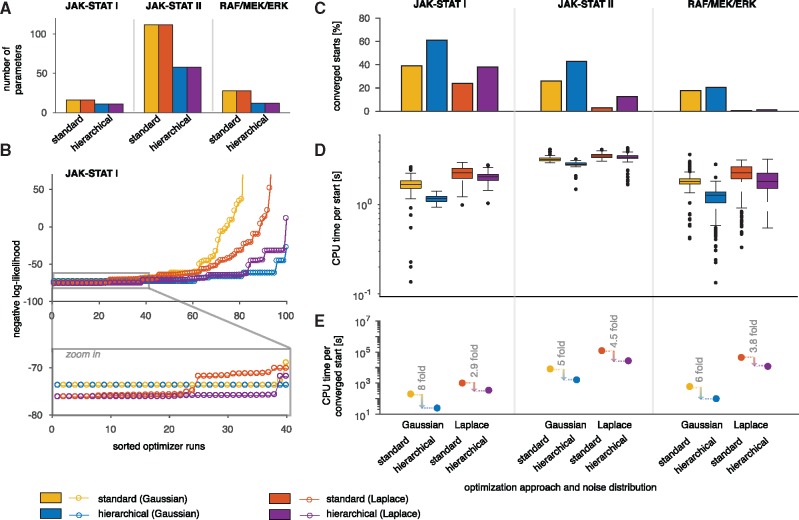
Fig. 4.
Evaluation of the standard and hierarchical approach for three application examples. (A) Number of optimization variables in the outer subproblem. (B) Likelihood waterfall plot for the JAK-STAT model I. The ascendingly sorted negative log-likelihood values are shown for both approaches (standard and hierarchical) and noise distributions (Gaussian and Laplace). (C–E) Comparison of the two optimization approaches and two noise distribution for the three models. (C) Percentage of converged starts over all performed local optimizations. (E) CPU time needed per converged start

