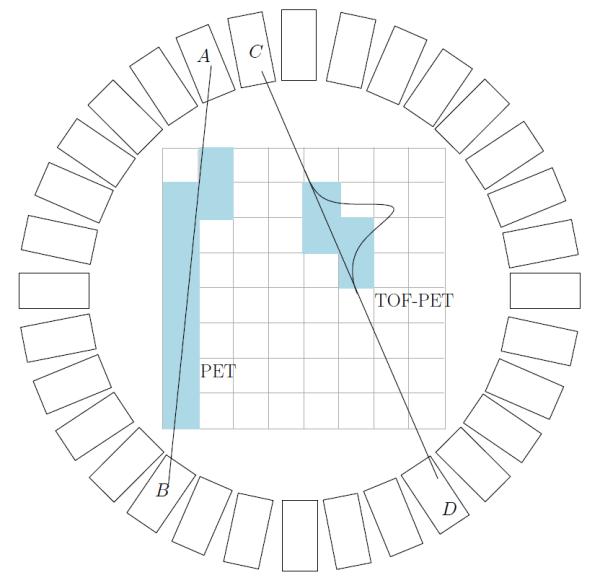
Figure 1.

Schematic drawing of a PET scanner. Rectangles represent detector crystals. For standard PET, coincidence event detected in A and B define a line along which the origin of the event is located. For time–of–flight PET the difference in time of arrival is measured and location of the origin is assumed to be located in some section of the line joining detectors C and D. Shaded pixels represent possible pixels that contain the origin of the event. Note that for the TOF the number of these pixels is substantially smaller indicating more precise localization.
