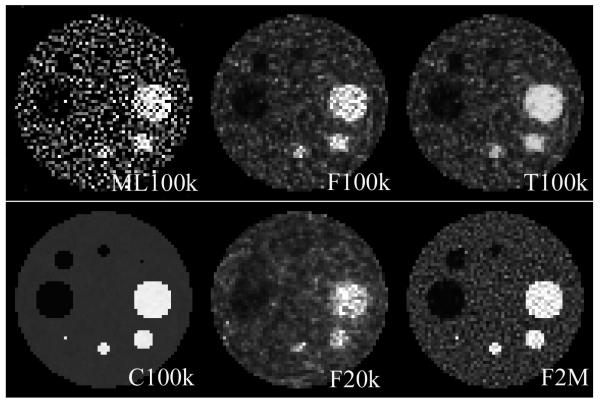
Figure 3.
Estimates of f using ML method, and MMSE estimates of the emission–count for different priors (F–flat, T–truncated flat, C–conjugate with perfect knowledge of the mean) and different total number of counts in the sinogram. We show ML image to demonstrate that noise structure is identical in ML and emission–count MMSE estimates. We are not trying to show the superiority of one method over the other.

