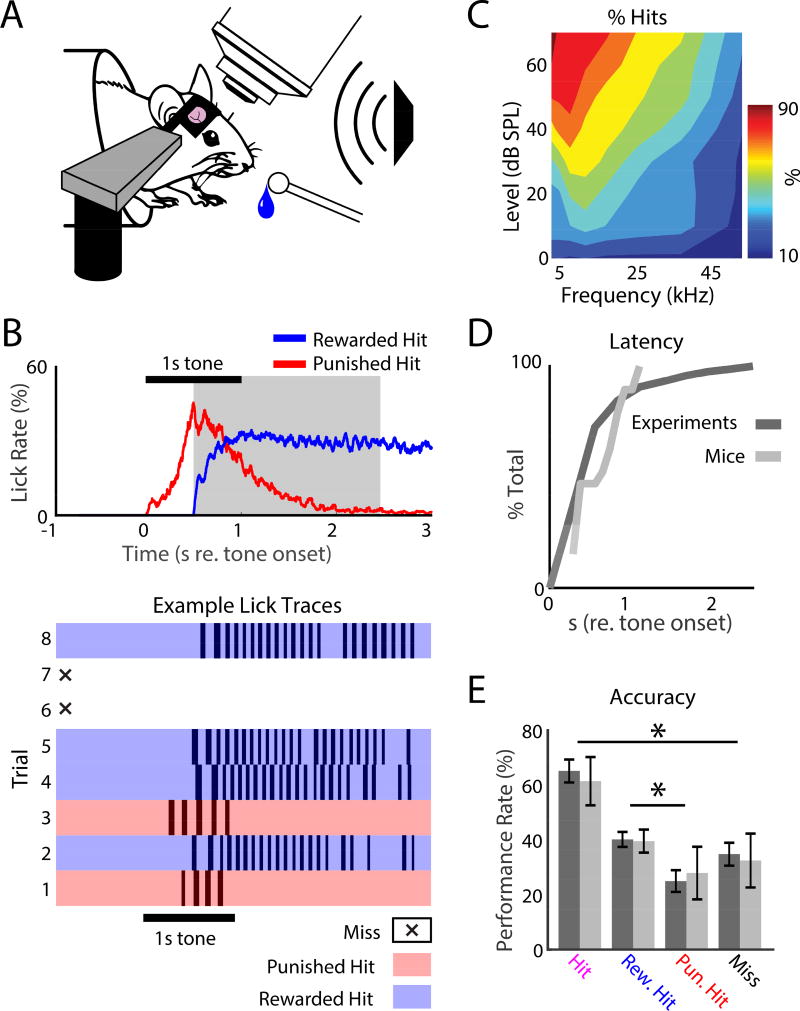
Figure 1.
2-Photon (2P) imaging in awake behaving mice. A. Head-fixed mice were trained to detect a 55 dB SPL, 1 s pure-tone presented from a free-field speaker, while neurons in A1 were imaged. Mice responded to tone detection by licking a waterspout. B. Tone detection behavior. Top: Average lick rate during task performance. Horizontal black bar shows when the target tone was presented. Red trace shows the average lick rate for punished hits, i.e., when the first lick occurred before the reward time-window (gray shaded region). No water was delivered after the first lick during punished hits, so the mice stopped licking. The blue trace shows the lick rate for rewarded hits indicating robust licking after receiving water. Bottom: example lick traces for 8 sequential trials during task performance. White regions with an X show miss trials, when the mouse did not respond. Blue and red regions show rewarded and punished hit trials respectively. C. Head-fixed task performance for roved tone levels to find the level (55 dB SPL) that produced a ~60–70% hit rate in the target frequency range (4–32 kHz). D. Cumulative distribution function (CDFs) for response latency (dark: total set of experiments; light: mice). E. Performance rates for each behavioral response-type for experiments (dark) and animals (light), respectively. Error bars show 2 standard errors of the mean (SEMs). Total hit rate: 65.2% ± 18.8% and 61.5% ± 13.9%, across experiments and animals, respectively. Rewarded hit rate: 40.2% ± 12.2% and 39.6% ± 6.7% across experiments and animals, respectively. Punished hit rate: 25% ± 17.7% and 28% ± 15.2% across experiments and animals, respectively. Miss rates: 35% ± 18.8% and 32.5% ± 15.5% across experiments and animals, respectively. Stars indicate significant differences between pairs of groups indicated by the bars: hits vs. misses (bootstrap t-test, experiments: p<0.001; animals: p=0.0011) and punished hits vs. rewarded hits (bootstrap t-test, experiments: p<0.001; animals: p=0.04).

