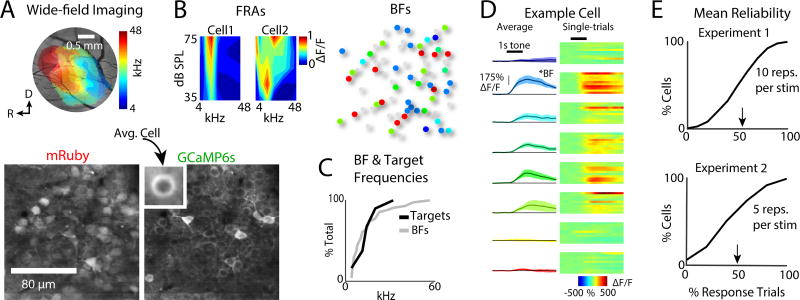
Figure 2.
Tone-evoked neuronal responses imaged in primary auditory cortex (A1) layer 2/3 show pure-tone frequency selectivity. A. Top left: Wide-field imaging used to localize A1, as indicated by a rostro-caudal gradient of high to low frequencies in the 4–48 kHz range (Fig. S1). Bottom: mRuby labeled cell bodies and GCaMP6s labeled cell membranes. B. Left: Two examples of frequency response areas (FRAs) generated by measuring responses to pure-tones presented at 35–75 dB SPL. Cells could show a narrow V-shape FRAs monotonic with level or show a wider FRA non-monotonic with level. Right: Best frequency (BF) of each cell for tones presented at 55 dB SPL. Gray cells were either too dim (see Fig. S3) or did not respond to pure-tones during passive trials. Color-coding same as A. C. CDFs of the set of pure-tone targets for each experiment (N=80 experiments), and BFs from all neurons (N=4316). D. Exemplar fluorescence traces from an A1 neuron in response to tones of different frequencies. Left column shows average of 10 repetitions of each frequency. Each row shows the data for a single tone frequency. Right column shows a heat-map for individual trial responses to each tone. E. Exemplar mean response reliability distributions from two experiments. Arrowheads indicate the mean. Response reliability was defined as the fraction of trials with significant responses in each cell, for the set of tones presented during Passive trials (Bandyopadhyay et al., 2010, Rothschild et al., 2010, Kanold et al., 2014, Maor et al., 2016, Winkowski et al., 2013). Reliability was similar for blocks of 5 or 10 trials per frequency.

