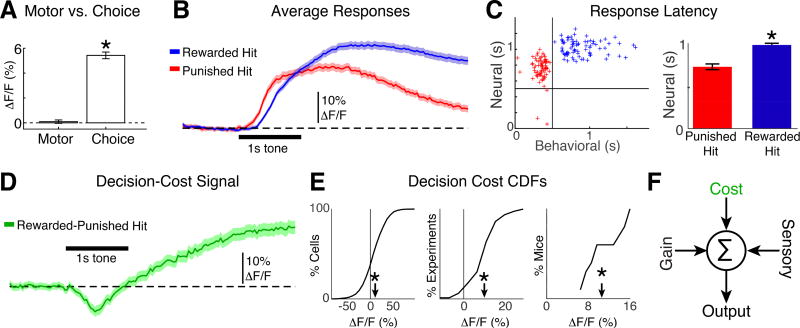
Figure 4.
Neurons in A1 encode decision timing and cost. A. Left: Time averaged activity aligned to licks during the silent period is similar to 0 (bootstrap t-test, p=0.5). Right: The time-averaged difference in activity of lick-aligned hit-miss trials (i.e., attentional gain, or “choice”) is positive (bootstrap t-test, p<0.001). B. Population average time-course of neural responses to tones during rewarded (blue) and punished (red) hits. Mice were trained to withhold licking for 0.5 s after the tone onset. Shading indicates 2 SEMs. C. Left: Average behavioral vs. neural response latencies for each experiment. Vertical and horizontal lines mark 0.5 s wait period. Right: Average neural response latency for punished and rewarded hits. ‘*” indicates p<0.001 (bootstrap t-test). Error bars show 2 SEMs. D. The time-course of the difference trace from panel B shows the dynamics of decision-cost (green; rewarded hit – punished hit). E. CDFs for decision-cost signaling for all cells (left), experiments (middle) and mice (right). Arrowheads indicate the means (9.5% +/− 0.78%, 9.1% +/− 1.7%, and 10.2% +/− 3.1% ΔF/F). ‘*’ indicate means different than 0 (bootstrap t-test, p<0.001). F. Model of A1 activity that is modulated by attentional gain, the cost of behavioral choice and sensory input.

