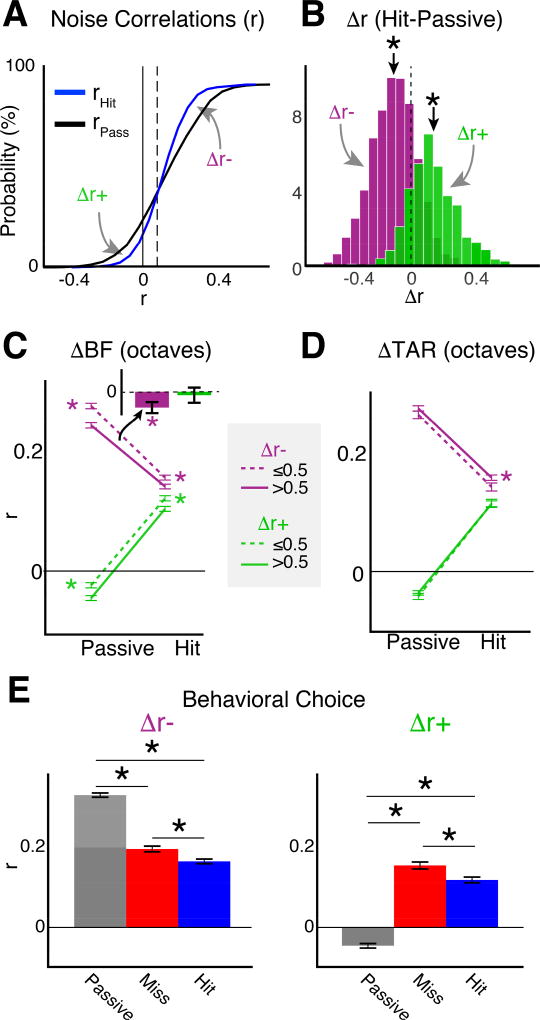
Figure 5.
Auditory attention modulates pairwise noise correlations in A1 L2/3. A. CDF of average pairwise neuronal noise correlations (r) for each neuron in the study (N=4316) during passive (black) and hit (blue) trials. The vertical dotted line shows the inflection point (r=0.09) where the sign of rHIT-rPASSIVE (i.e., Δr) reverses. Δr values indicated by the gray arrows pointing below (Δr+) and above (Δr−) the inflection point were separated for subsequent panels. B. Probability density functions (PDFs) for Δr+ and Δr−. ‘*’ indicate means different than 0 (bootstrap t-test, p<0.001). C. r values for cells grouped by the octave distance between best frequencies (ΔBF). The mean values for Δr+ for hit vs passive were ΔBF≤0.5: 0.12 ± 0.007 vs. −0.02 ± 0.007; ΔBF>0.5: 0.1 ± 0.007 vs. −0.05 ± 0.007. The mean values for Δr− for hit vs passive were ΔBF≤0.5: 0.16 ± 0.005 vs. 0.27 ± 0.006; ΔBF>0.5: 0.14 ± 0.005 vs. 0.24 ± 0.006. ‘*’ indicate differences between BF groups in Δr−group for both active and passive (bootstrap t-test, p<0.001). Error bars show 2 SEMs. Inset shows differences in Δr between BF groups (Δr (ΔBF≤0.5) - Δr (ΔBF>0.5)) and indicate that for Δr−cells with ΔBF<0.5 showed the largest reduction in r. D. Noise correlations as function of BF relative to the target frequency (ΔTAR). The average noise correlations for Δr− in hit vs passive trials were: ΔTAR≤0.5: 0.14 ± 0.008 vs. 0.26 ± 0.008; ΔTAR>0.5: 0.15 ± 0.006 vs. 0.27 ± 0.006. The average noise correlations for Δr+ in hit vs passive trials were: ΔTAR≤0.5: 0.11 ± 0.01 vs. −0.04 ± 0.009; ΔTAR>0.5: 0.11 ± 0.008 vs. −0.04 ± 0.006. E. Attentional effect on noise correlations across all neurons. ‘*’ indicate p<0.001, KW-test.

