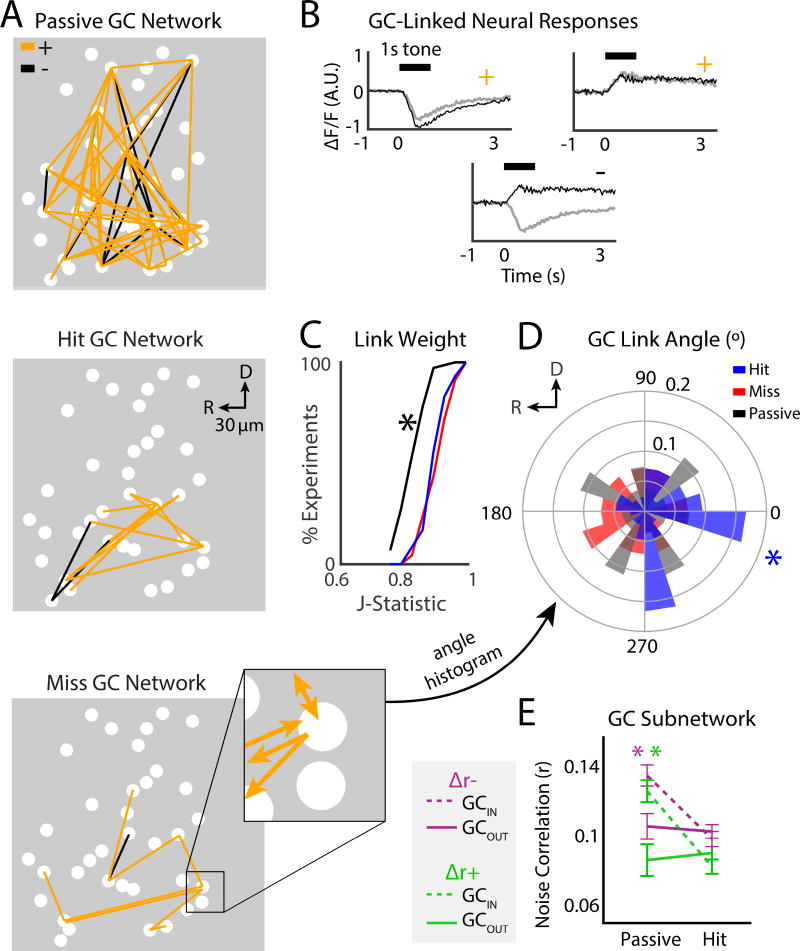
Figure 6.
Granger causality (GC) subnetwork structure was modulated by task performance. A. GC analysis was used to find directional links (i.e., effective connections) between neurons. Example GC networks during passive (top), hit (middle), and miss (bottom) trials. Positive (+) and Negative (−) links are shown in orange and black, respectively. Magnification shows example of directionality for individual GC-links. B. Example traces of pairs of + or − GC-linked neurons. C. CDF of GC link weight. ‘*’ indicates difference between the passive and hit trials (bootstrap t-test, p<0.001). Trends were similar across mice (see Supp Table 1). D. GC link angle. ‘*’ indicates the significant rostro-caudal directionality of links during hit trials (Rayleigh test, p=0.03). E. Pairwise noise correlations for cells inside a GC subnetwork (GCIN) and cells outside of a subnetwork (GCOUT). Average Δr− noise correlations for GCIN cells for hit vs. passive trials: 0.098 ± 0.006 vs. 0.135 ± 0.008. Average Δr− noise correlations for GCOUT cells: 0.103 ± 0.005 vs. 0.11 ± 0.011. GC Average Δr+ noise correlations for GCIN cells for hit vs. passive trials: 0.08 ± 0.007 vs. 0.13 ± 0.01. Average Δr+ noise correlations for GCOUT cells for hit vs. passive trials: 0.09 ± 0.006 vs. 0.09 ± 0.02. For both Δr− and Δr+ groups, GCIN cells had larger noise correlations during passive trials compared to GCOUT cells, and significantly decreased noise correlations during hit trials (green and purple ‘*’ bootstrap t-test, p<0.001). Noise correlations in GCOUT cells were similar for hit and passive trials (bootstrap t-test, Δr−: p=0.62, Δr+: p=0.66).

