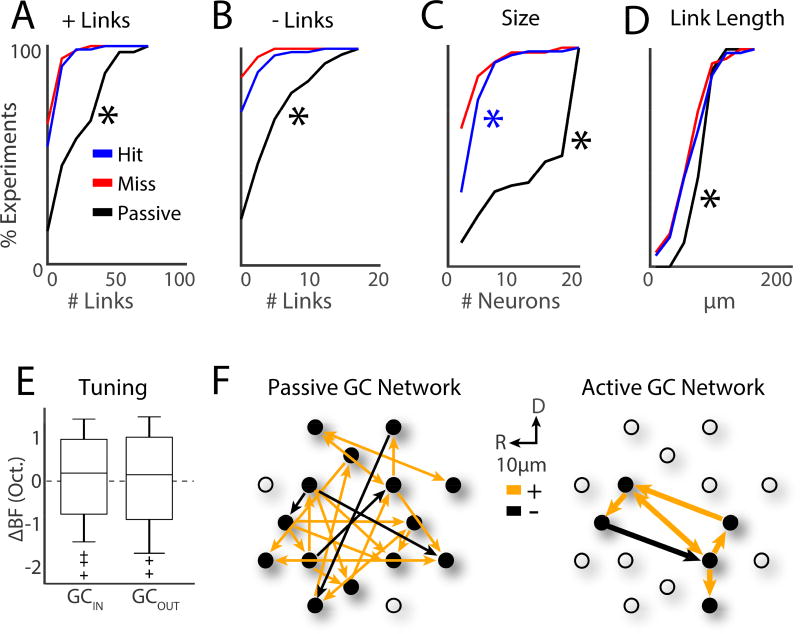
Figure 7.
Tone detection drives GC subnetworks into small and localized clusters of 4–5 neurons with diverse frequency tuning. A. CDF for number of +links. ‘*’ indicates differences between passive and hit trials (bootstrap t-test, p<0.001). B. CDF for number of −links. C. CDF for GC subnetwork size. Blue ‘*’ indicates a significant difference between the hit and miss trials (bootstrap t-test, p=0.019). D. CDF for GC link length. E. BF differences (ΔBF) between pairs of cells for GCIN and GCOUT cells. Populations were similarly distributed, and means similar to 0 (bootstrap t-test, p>0.05). F. Illustration of passive and active (i.e., hit) GC networks.

