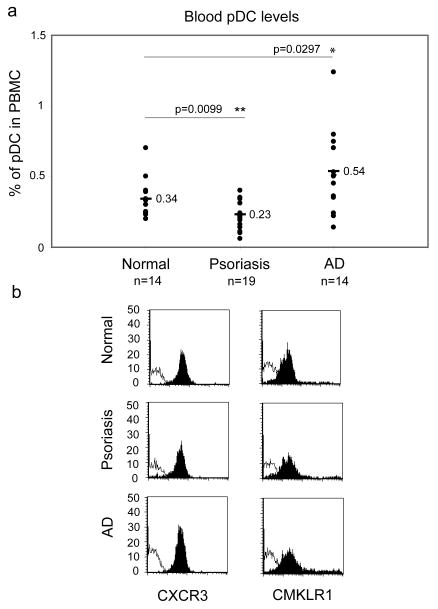
Fig. 1. Circulating pDC from normal, psoriasis and AD patients express similar surface levels of CXCR3 and CMKLR1.
PBMC were isolated from the blood of indicated donors and stained for pDC using anti-CD123 and anti-BDCA2 mAbs. The cells were then analyzed by flow cytometry. (a) Data are shown as percentage of pDC among PBMC. Lines indicate the mean value for each data set. Statistically significant differences between normal and psoriasis or AD pDC levels are indicated by asterisks (*, p<0.05; **, p<0.01; Student's t test). (b) Gated pDC were plotted for CXCR3 (left column, black histograms) or CMKLR1 (right column, black histograms). Thin open histograms represent profiles of negative control mAbs. Fluorescence intensity from one representative experiment out of five independent experiments is shown.

