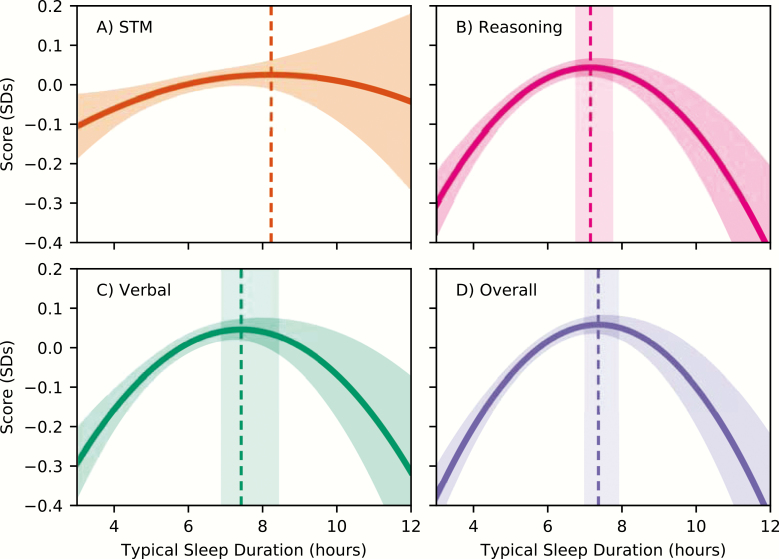
Figure 3.
Predicted score performance as a function of sleep duration, for (A) STM, (B) Reasoning, (C) Verbal, and (D) Overall scores, in units of standard deviations. Although STM did not show a significant relationship with typical sleep duration, it is included for comparison. Shaded regions on top and bottom of the curve indicate 95% confidence intervals of the prediction. Vertical dashed lines indicate the location of the curves’ maxima, with shaded 95% confidence intervals prediction (except for STM, where they could not be calculated due to a nonsignificant quadratic term).

