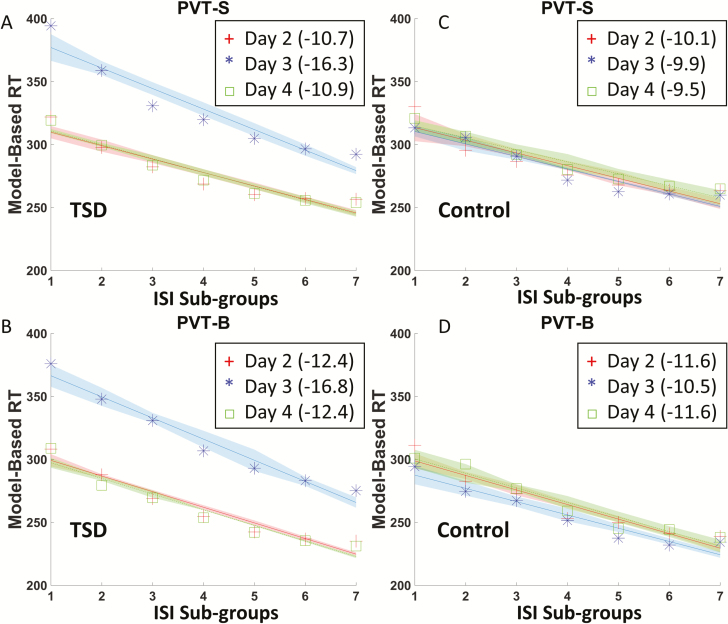
Figure 8.
Sleep deprivation changed the relationships between the ISI sub-groups and RT on both PVT-S and PVT-B. Red cross in each picture represents median RT of each ISI sub-group from day 2 (baseline), red line is a linear regression of red cross, and shadow represents standard error of each data point. Likewise, blue and green denote data from day 3 (sleep deprivation) and day 4 (recovery), respectively. Slopes of each line are shown in the bracket. (A and B) Sleep deprivation significantly changed the slopes of regression line for both PVT-S and PVT-B (p < 0.001). (C and D) No differences were found among the slopes in 3 days in the control group for both PVT-S and PVT-B (all p > 0.1).

