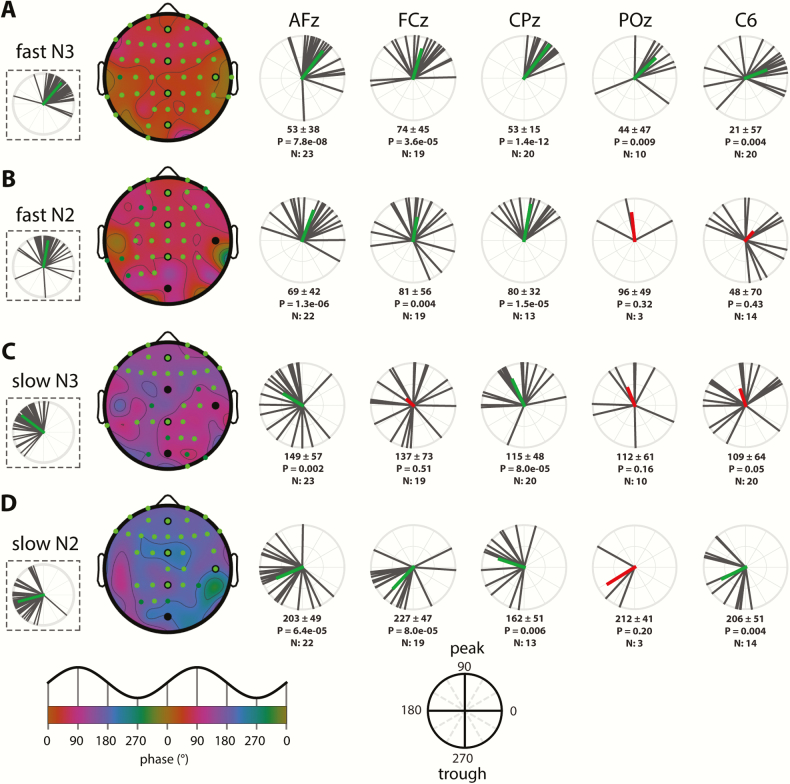
Figure 4.
SO-spindle coupling phases across the scalp and individuals. (A) Fast N3 spindles. (B) Fast N2 spindles. (C) Slow N3 spindles. (D) Slow N2 spindles. Left: topographies of mean preferred coupling phase across individuals, with dashed insets on the left showing circular distributions across channels (black vectors: individual channels, averaged across individuals; green vectors: channel averages). Green-colored circles on topographical maps indicate electrodes showing significantly nonuniform phase distributions across participants after correcting for multiple comparisons (bright green) or uncorrected (dark green). Black circles indicate selected electrodes plotted on the right. Right: circular plots display phase distributions across individuals (black). Participant-averaged vectors (colored) indicate both average phase and cross-participant consistency, expressed as its length. Numbers below each circular plot indicate mean phase (±SD), p value (uncorrected) of Rayleigh tests for nonuniformity, and number of included participants. Mean vector is colored green when the uncorrected p is <0.05, and red otherwise. Bottom insets indicate mapping from phases to topographical color map and circular plots.

