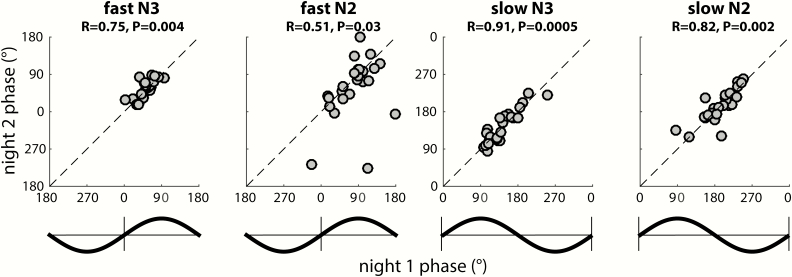
Figure 8.
Stable individual differences of global SO-spindle coupling phase. Each scatter plot shows individuals’ preferred coupling phases for nights 1 (x-axis) and 2 (y-axis). Each individual’s coupling phase estimates are averaged across all available electrodes. Correlation coefficients (R) and (uncorrected) p values from circular correlation analyses are indicated above each plot. Note the different axis scales for fast and slow spindles, also indicated by schematic SO waveforms. Also note that because of the circular nature of phase estimates, data points close to the edge “wrap around” and are also close to the opposite side.

