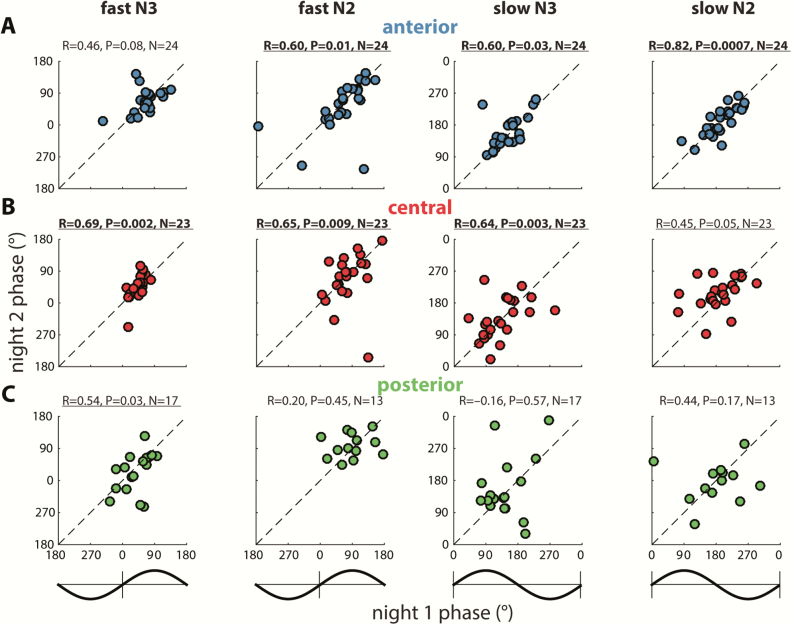
Figure 9.
Stable individual differences of regional SO-spindle coupling phase. Figure layout as in Figure 8, only with coupling phases averaged separately across available anterior (A), central (B), and posterior electrodes (C). Number of included participants (N) indicated above each plot. Note that for these analyses, participants are included only when they have ≥ 20 SOs on at least one electrode in the analyzed region in both nights. Significant (p < 0.05, uncorrected) correlations are underlined, and correlations surviving multiple comparison correction are indicated in bold.

