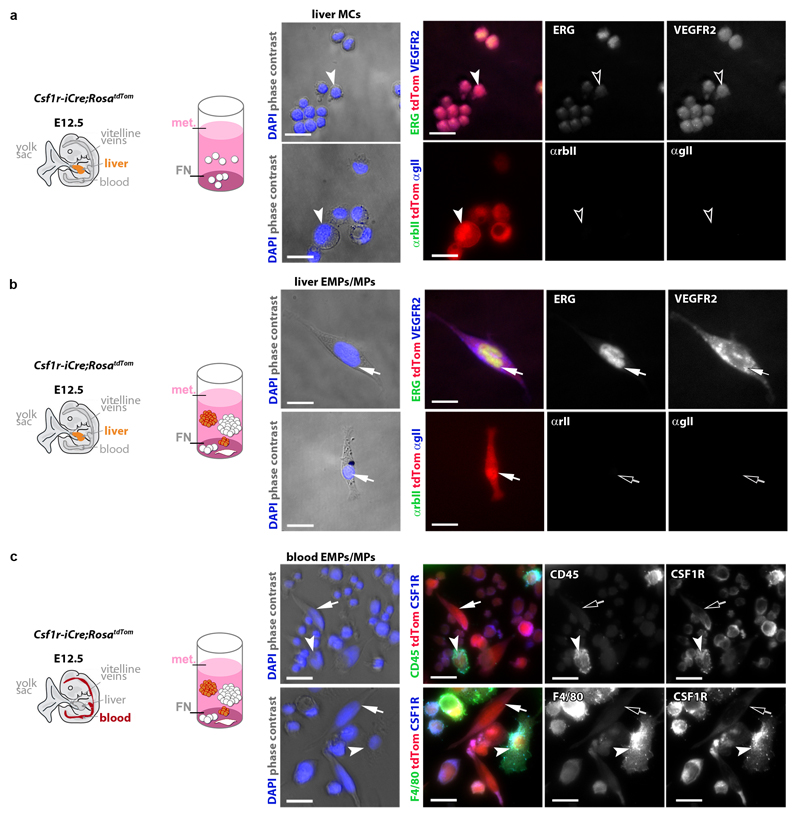
Extended data figure 4. Immunostaining controls for cultured Csf1r-iCre-targeted cells.
The indicated cell populations were FACS-isolated from E12.5 Csf1r-iCre;RosatdTom liver or blood with the indicated markers and cultured for three days in methocult (met.) on fibronectin (FN); n = 1 experiment. Adherent cells from tdTom+ liver MC (a) and EMP/MP (b) cultures were stained for ERG and VEGFR2 (top panels) or with secondary antibodies only (bottom panels). In (c), adherent cells from tdTom+ blood EMP/MP cultures were immunostained for CSF1R together with the myeloid markers CD45 (top panels) or F4/80 (bottom panels). In the first panel in each row, the phase contrast and DAPI images were merged. In panels 2-4 in each row, immunolabelled cells were visualised together with tdTom fluorescence, with single channels for the indicated markers shown separately in grey scale. Symbols: Arrows indicate tdTom+ ECs, arrowheads tdTom+ myeloid cells; solid and clear symbols indicate the presence or absence, respectively, of the indicated markers. Scale bars: 20 µm.

