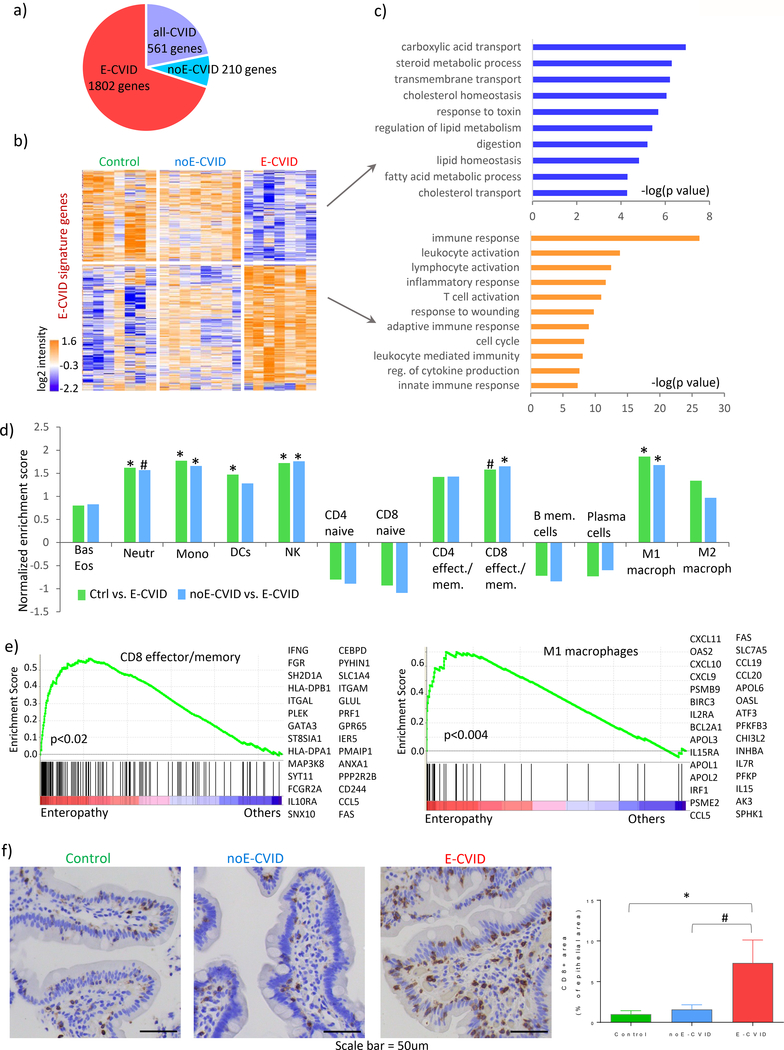
Figure 1.
Gene expression and cellular characterization of CVID enteropathy. (a) Number of genes assigned to each of the three signatures (E-CVID, noE-CVID and all-CVID) defined as described in Methods and Supplementary Figure 1. (b) heatmap of genes in E-CVID profile; columns, samples (Control n=7, noE-CVID n=8, E-CVID n=7), rows, genes; log2 normalized intensities of gene expression across all samples are represented. (c) Enriched Gene Ontology terms (Biological Process) in E-CVID profile (p-values obtained using DAVID bioinformatics resources). (d) Gene set enrichment analysis (GSEA) for hematopoietic cell types in E-CVID vs. other groups; *p<0.05; # p<0.1 by permutation test implemented in GSEA. (e) GSEA leading edge scores and genes for CD8 effector/memory cells and M1 macrophages. Leading edge plots for other enriched populations are in Supplementary Figure S2. (f) Representative images and quantitative analysis of CD8 staining in biopsies from Control (n=4), noE-CVID (n=6), E-CVID (n=7), Mann-Whitney one-sided test *p<0.05; #p<0.1, mean, SEM shown. Abbreviations: E-CVID, enteropathy associated with common variable immunodeficiency; noE-CVID, CVID without enteropathy; Ctrl, Control; Bas, basophils, Eos, eosinophils; Neutr, neutrophils; Mono, monocytes; DCs, dendritic cells; NK, natural killer cells.

