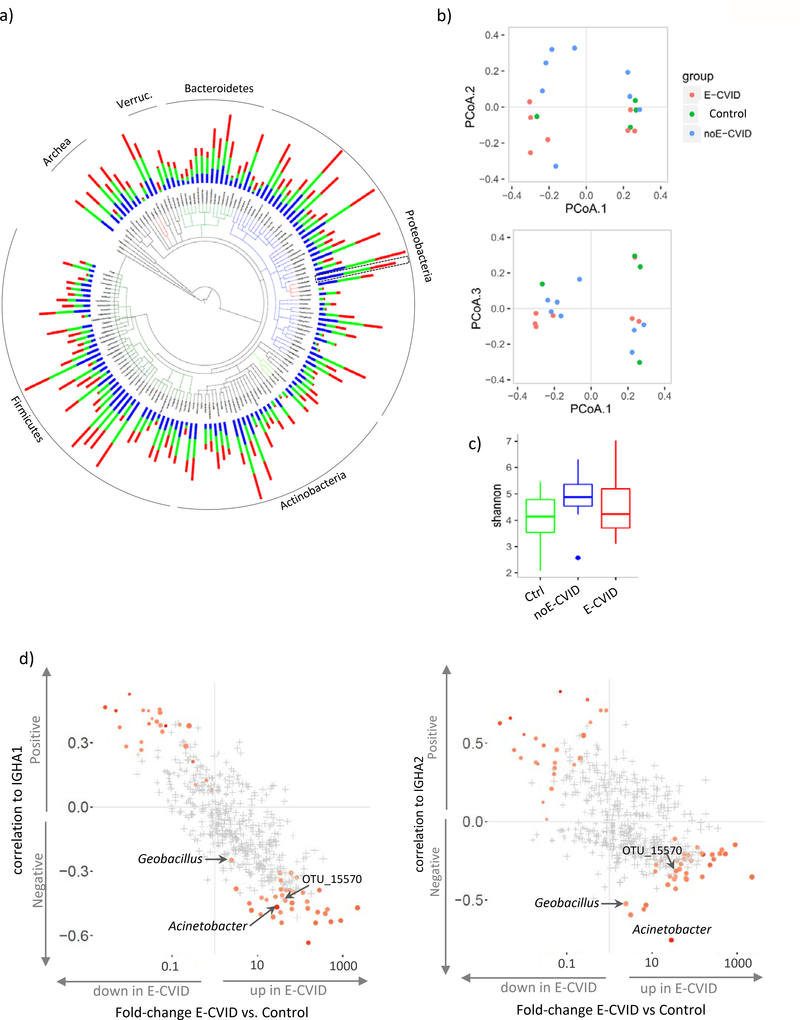
Figure 3.
Microbiome analysis of duodenal biopsies. (a) Tree-of-life plot at the genus level; bars represent relative frequencies; red, E-CVID, blue, noE-CVID, green, Control; Acinetobacter genus is indicated by dashed box as it will be focus of the analysis in Fig 4. (b) Principal coordinate analysis of microbiota composition in biopsies. (c) Shannon index estimating microbiome diversity in groups of samples; blue dot is an outlier sample, no significant differences detected between groups by one-sided t test. (d) Correlations between OTU abundances and levels of IGHA1 (left) or IGHA2 (right) mRNA plotted against change in OTU Frequency in ECVID vs. all other samples. OTU, operational taxonomic unit. Red color indicates OTUs that pass FDR 0.2 with stronger intensity corresponding to lower FDR. OTUs marked in grey present FDR above 0.2. E-CVID, enteropathy associated with common variable immunodeficiency; noE-CVID, CVID without enteropathy; Ctrl, Control subjects.

