Figure 5.
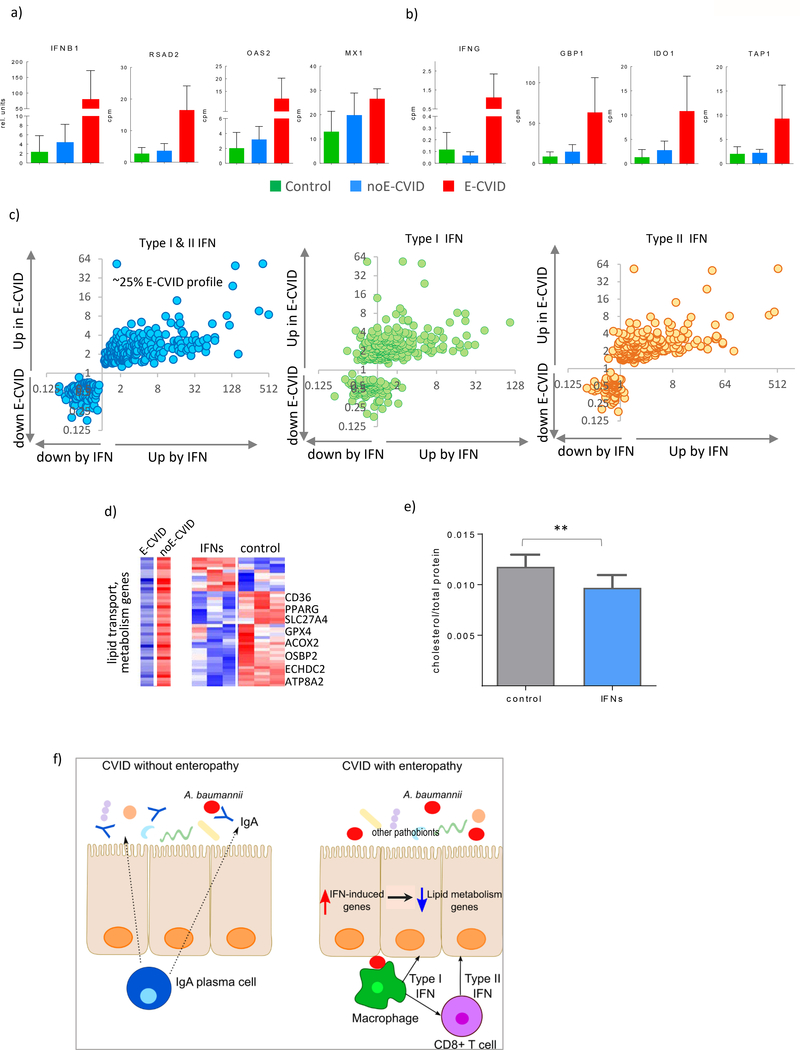
Interferons Drive Inhibition of Lipid Metabolism in Epithelial Cells. (a) Expression of IFNB1 and IFN type I dependent genes (RSAD2, OAS2, MX1) in duodenal biopsies from of CVID patients with (red), without (blue) enteropathy and control subjects (green), all genes passed false discovery rate <0.03 comparing E-CVID to other two groups. (b) expression of IFNG and IFN type II dependent genes (GBP1, IDO, TAP1); (c) Gene expression ratios between E-CVID and control individuals (y axis) and between interferon treated versus untreated human epithelial cells (x axis; n=3 per group), left panel both types of interferons; middle panel interferon type I; right panel interferon type II. (d) Expression of genes defined as lipid metabolism by Gene Ontology and downregulated in E-CVID, representative genes are indicated; left panel: median values in E-CVID and noE-CVID tissues; right panel: individual values in cells treated and untreated with both interferons, red is high and blue is low expression; (e) intracellular cholesterol levels in epithelial cells treated or untreated with both types of interferons data presented as mean±s.e.m.; each column number of biological replicates equals 14 (**p<0.0001 by one-tailed Wilcoxon test); (f) model of CVID enteropathy.

