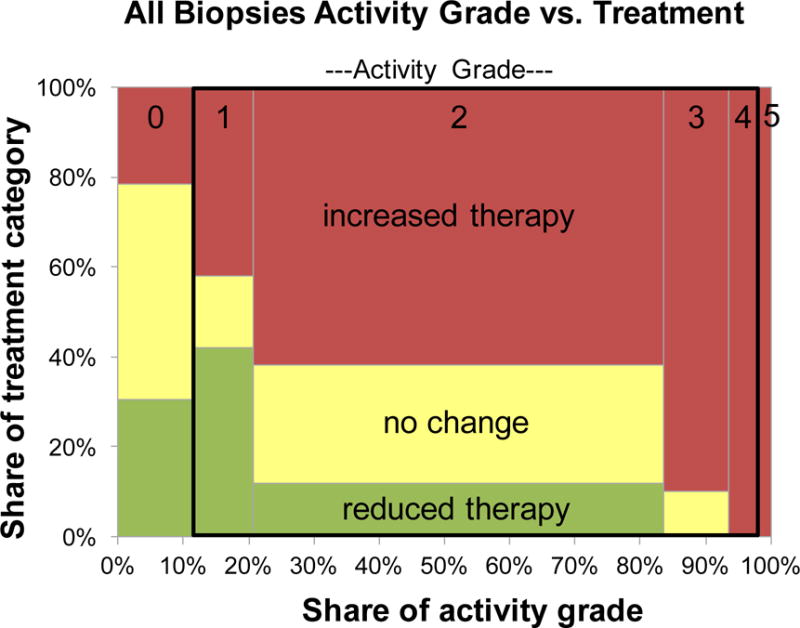
Figure 3.

Marimekko chart showing relation between activity grade and change in therapy for all specimen sites, and within the black rectangular outline, the subset of specimens with activity grades 1, 2, 3, and 4. The area reflects number of specimens in each activity grade or therapeutic change category.
