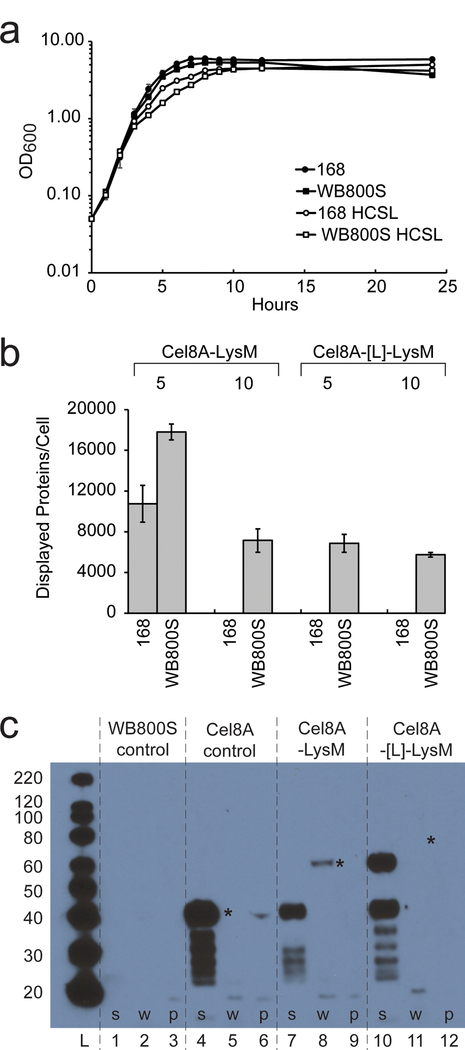
Figure 2:

Reporter protein display in B. subtilis strains 168 and WB800S. (A) Representative growth curves of B. subtilis 168 (solid circles) and corresponding Cel8A-LysM expressing cells (open circles). Growth curves of parent WB800S and Cel8A-LysM expressing cells are also shown, open and solid squares, respectively. Protein expression only modestly decreases cellular growth. (B) Bar graph showing the amount of displayed reporter protein per cell sampled at mid-log (T = 5 hours) and stationary phase (T = 10 hours). Cel8A-LysM (left) and Cel8A-[L]-LysM (right) cells were expressed in wild-type 168 and protease-deficient WB800S strains. Per cell protein estimates were determined using a cellulase assay as described in the text. Genetically eliminating bacterial proteases increases display, but activity declines after the cells enter the stationary phase. (C) Western Blot of fractionated B. subtilis WB800S and cells expressing the Cel8A, Cel8A-LysM, and Cel8A-[L]-LysM reporter proteins. Cells were fractionated into secreted, cell wall, and protoplast fractions and reporter proteins detected using primary anti-His6 mouse monoclonal antibody, and secondary anti mouse Anti-IgG – HRP. ‘*’ indicates the expected location of the intact Cel8A, Cel8A-LysM, and Cel8A-[L]-LysM reporter proteins. A band for Cel8A-[L]-LysM in lane 11 is present, but is too faint to be seen in this image. Lanes are as follows: molecular weight ladder (L); lanes 1, 4, 7, 10 secreted fractions; lanes 2, 5, 8, 11 cell wall fractions; lanes 3, 6, 9, 12 protoplast fractions. The protoplast fraction was diluted by 10X relative to the other lanes.
