Figure 6.
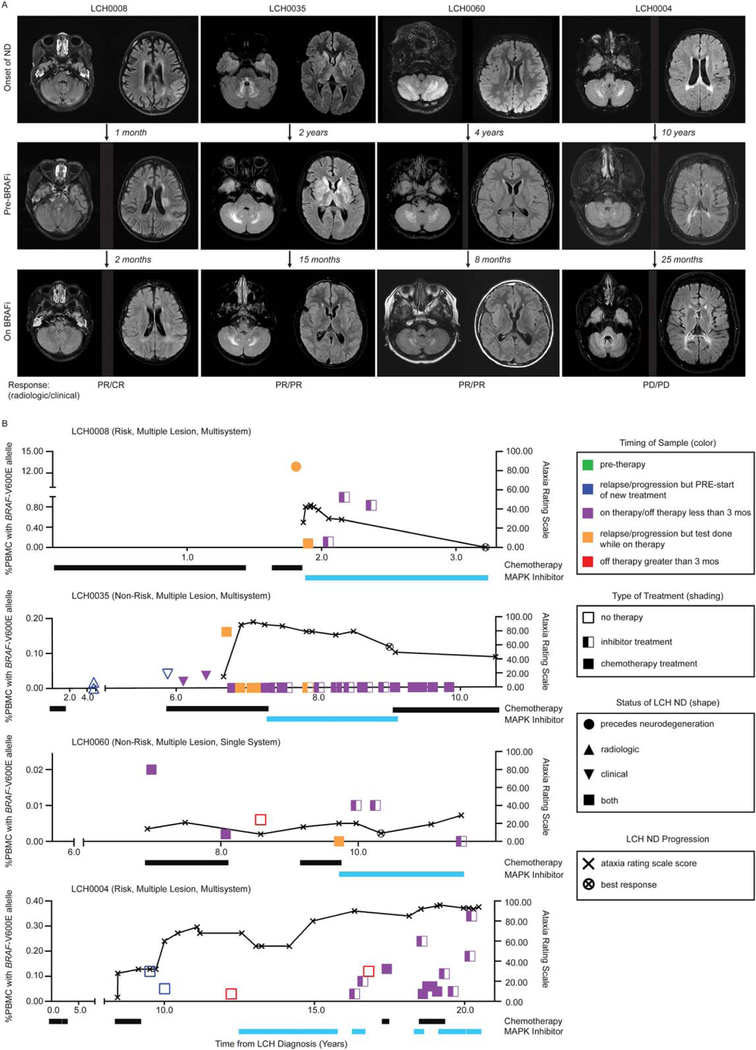
Radiographic and clinical responses of LCH-ND to chemotherapy and MAPK pathway inhibition. (A) Magnetic resonance images (T2 FLAIR) of patients with LCH-ND at onset of neurodegenerative disease (ND) (top panel) before BRAFV600E inhibitor therapy (middle panel) and on BRAFV600E inhibitor therapy at the time of best response or longest duration (if there was no response on therapy) (bottom panel). Time in months/years indicates time between each image. Radiologic and clinical responses at the time of the MRI image at best response are reported as complete response (CR), partial response (PR), stable disease (SD), or progressive disease (PD). Three out of 4 patients with progressive disease on chemotherapy had clinical CR or PR and radiologic PR to BRAF inhibition. One patient with long-standing ND showed periods of stable radiologic and clinical disease but experienced clinical and radiologic progression overall despite BRAF inhibition. (B) Corresponding clinical and molecular responses for each patient. Clinical symptoms are reported using the ataxia rating score (0–100), with best response on BRAF-V600E inhibition indicated by an “x.” The molecular response (%BRAFV600E+ PBMC) was measured over serial blood samples while on cytotoxic chemotherapy (black bar) or BRAF-V600E inhibition (blue bar). Detailed clinical courses and radiologic interpretation are outlined in the clinical response forms (Supporting Table 4A-D).

