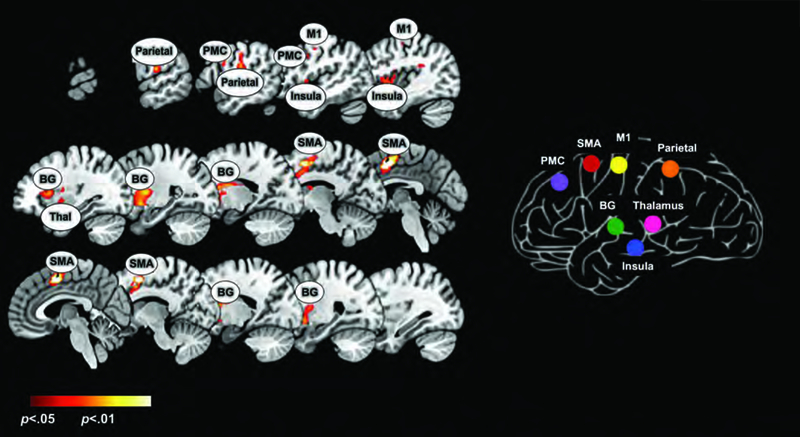
Figure 1.

The left panel depicts the results of a conjunction analysis (Left Hand ᴖ Right Hand) derived from second level random effects model (see Methods). Significant clusters (p<0.05, cluster level) under this analysis depict regions co-activated regardless of the hand used in responding. Results are overlaid on a mosaic of sagittal slices with peaks in the BG, PMC, Insula, M1, SMA, parietal, and thalamus labelled. These peaks were forwarded for uFC analyses, and the figure on the right reveals the reduced matrix of regions (see also Figures 3–5). Subsequent figures/analyses are focused on quantifying changes in the uFC of sub-networks in this matrix.
