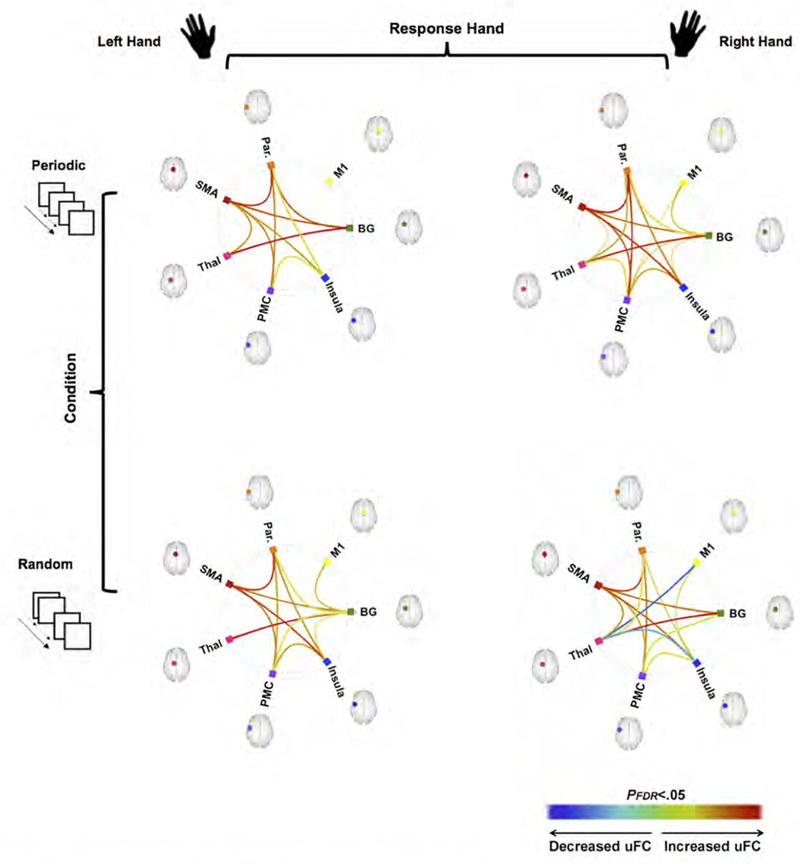
Figure 2.

The framework of the overall experimental design and analyses are depicted with each of the two factors, Response Hand (Left vs. Right) and Visuo-Motor Condition (Periodic vs. Random) shown horizontally and vertically respectively (for a total of four conditions). Under this framework and in each of the connectomic rings, we denote edges representing sub-networks the uFC between which was significantly modulated under each condition (warm colors represent increased uFC, cool colors represent decreased uFC).
