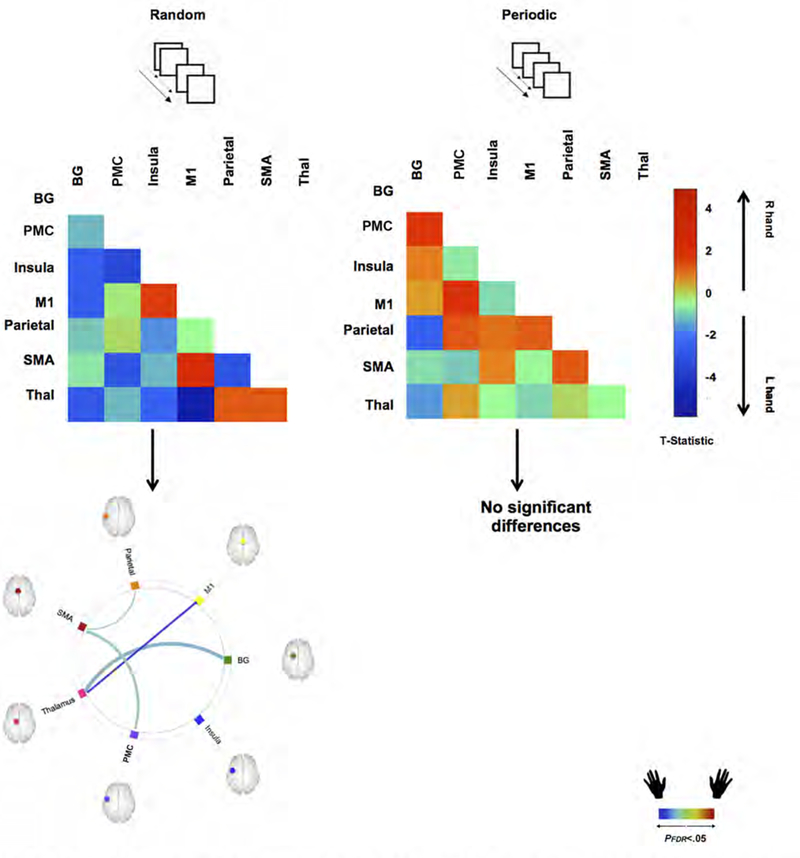
Figure 5.

The figure depicts how Response Hand (Right vs. Left) induces differences in uFC under each of the Periodic or Random visuo-motor conditions. The adjacency matrices depicted unthresholded t-maps. A positive t-statistic indicates greater uFC when responding with the Right Hand (warm colors) and a negative t-statistic indicates greater uFC when responding with the Left Hand (cool colors). Below these “heat” matrices, we present statistically thresholded differences, depicted as edges in the connectomic rings. As seen, significant differences are only observed under the Random condition, wherein responding with the Left Hand induces greater uFC in multiple sub-networks (see text).
