
Figure 6.
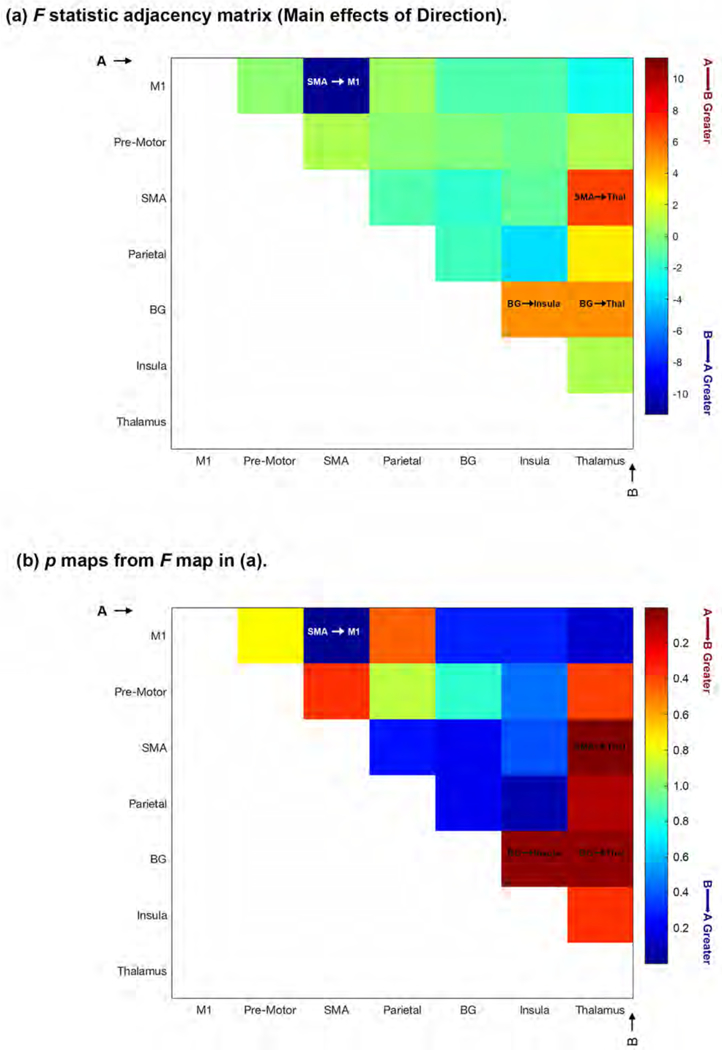
The figure depicts un-thresholded F- (6a) and p-matrices (6b) depicting statistical effects associated with the Main Effect of Direction (A → B vs. B → A) for each analyses of variance conducted on sub-network pairs. The colors encode directional effects, resulting in asymmetric adjacency matrices. The vertical and horizontal axes are labeled “A” and “B” respectively: The warm colors indicate greater significance in the A → B direction, the cool colors indicate greater significance in the B → A direction (see color bar). Four significant main effects of Direction were observed (clearly indicated in the relevant cells): BG → Thalamus, SMA → Thalamus, BG → Insula and SMA → M1 (see Results for detailed statistical information.