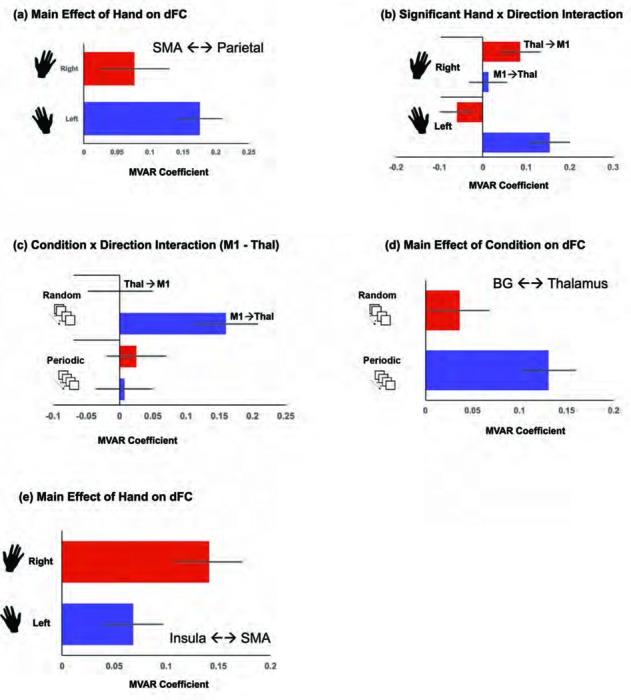
Figure 7.

The Figure depicts ancillary effects from the dFC analyses to show: a) greater dFC during Left hand, than Right hand responses on the SMA ←→ Parietal pathway, b) a significant Hand x Direction interaction on the M1 ←→ Thalamus pathway, c) A significant Condition x Direction interaction on the M1 ←→ Thalamus pathway, d) greater dFC during Periodic compared to Random conditions on the BG ←→ Thalamus pathway, and e) marginally greater dFC during Right hand, than Left hand responses on the Insula ←→ SMA pathway. In all graphs, we plot the estimated MVAR coefficient (see Methods), and error bars are ± sem.
