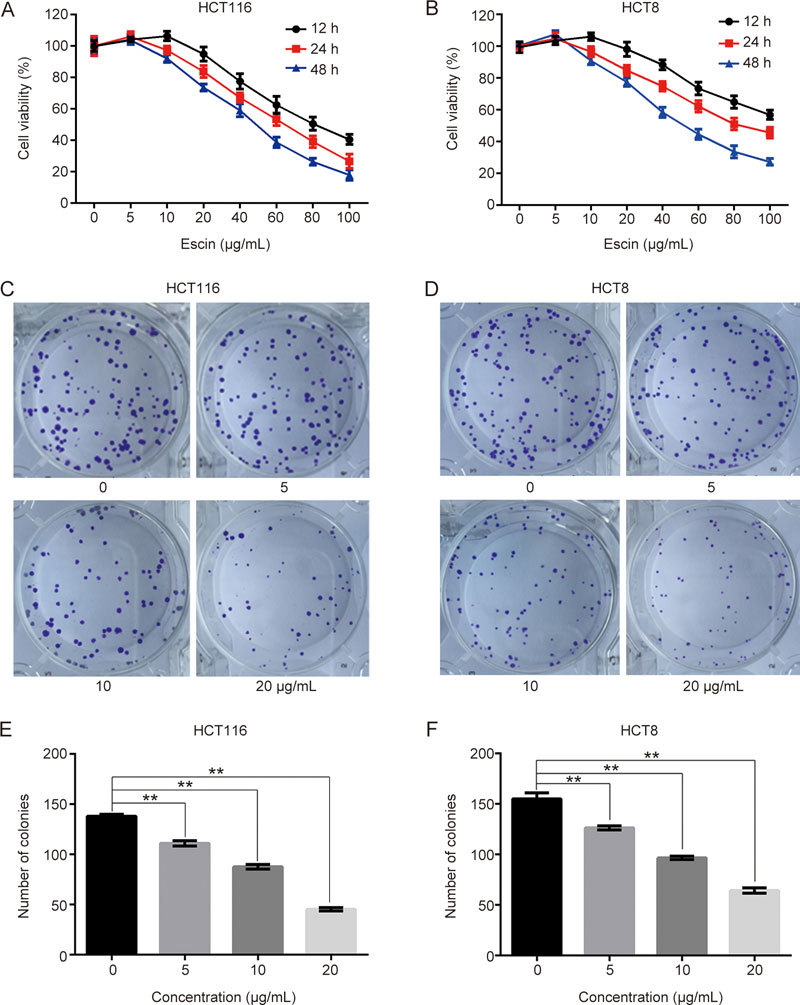
Figure 1.

Escin inhibited proliferation in HCT 116 and HCT-8 cells. (A–B) Cells were treated with a series of concentrations of escin (0–100 μg/mL) for 12, 24 or 48 h, and cell viability was measured by the CCK8 assay. (C–D) A total of 200 cells were seeded in 6-well plates and cultivated for 12–14 d. Colony formation was detected. (E–F) Quantitative analysis of the colony numbers of HCT116 and HCT8 cells after escin treatment. The values are the mean±SD from three independent experiments. ** P<0.01 vs the control group.
