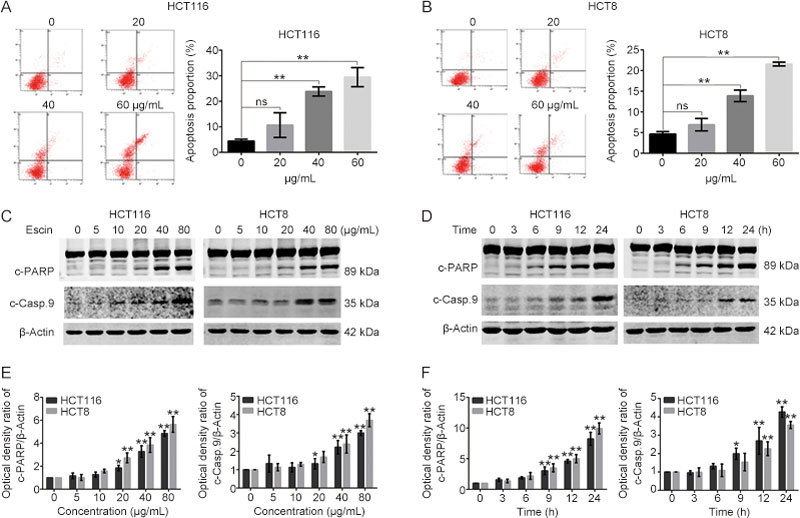
Figure 4.

Escin induced apoptosis. (A–B) Escin induced apoptosis. Cells were treated with escin for 12 h, and apoptosis was analyzed by FACS. Quantitative analysis of apoptosis is shown. (C–F) Escin induced upregulation of apoptosis related proteins. Cells were incubated with different concentrations of escin for 12 h or treated with 60 μg/mL of escin for 3, 6, 9, 12 and 24 h. Apoptosis related proteins (cleaved-PARP and cleaved-caspase 9) were detected by Western blotting (C and D). Quantitative analysis of the optical density ratio of cleaved-PARP and cleaved-caspase 9 compared with β-actin is shown (E–F). The values are the mean±SD from three independent experiments. ns P>0.05, * P<0.05, ** P<0.01 vs the control group.
