Fig. 2.
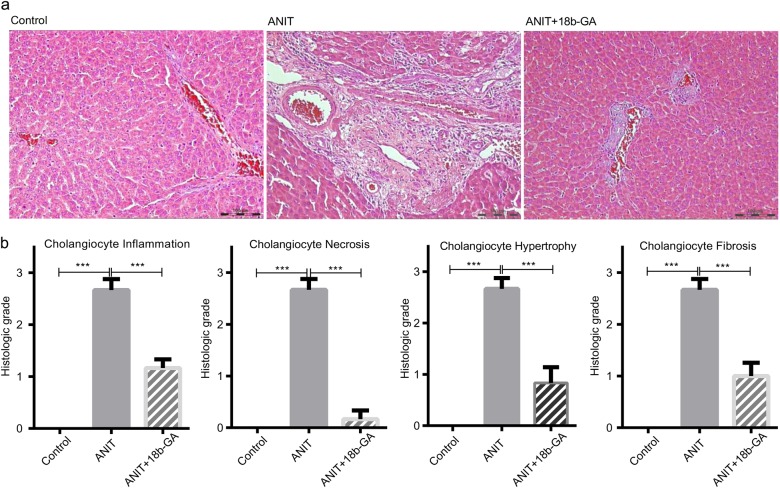
Liver histology of ANIT-treated rats and 18b-GA-attenuated liver injury induced by ANIT. a Liver tissues were fixed, followed by H&E staining (×200). No histological change was observed in the control group, large areas of necrosis and inflammation were observed in the ANIT-treated group, and a few spotty areas of necrosis and inflammation were observed in the ANIT and 18b-GA cotreated group. b The graph shows the semi-quantitative analysis of cholangiocyte inflammation, necrosis, hypertrophy, and fibrosis. Data are shown as the mean ± SEM. (n = 6). *P < 0.05, **P < 0.01, ***P < 0.001 compared with the ANIT-treated group

