
Figure 4.
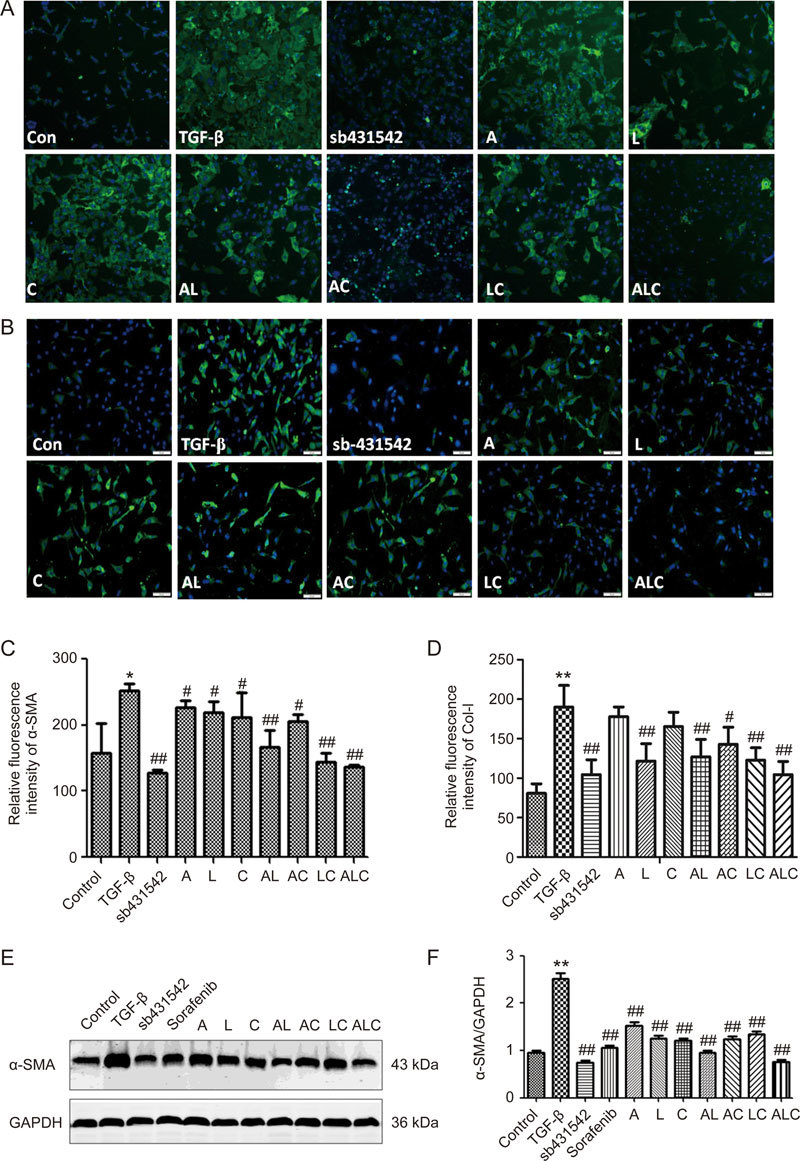
ALC formula decreased the expression of α-SMA and collagen I in LX-2 cells. (A) Fluorescence intensity of α-SMA by High Content Screening. (B) Fluorescence intensity of collagen I by High Content Screening. (C) Semi-quantitative analysis of the relative fluorescence intensity of α-SMA. (D) Semi-quantitative analysis of the relative fluorescence intensity of collagen I. (E) Western blot assay of α-SMA in LX-2 cells. (F) Semi-quantitative analysis of α-SMA level. * P<0.05, ** P<0.01 vs control group. # P<0.05, ## P<0.01 vs model group.