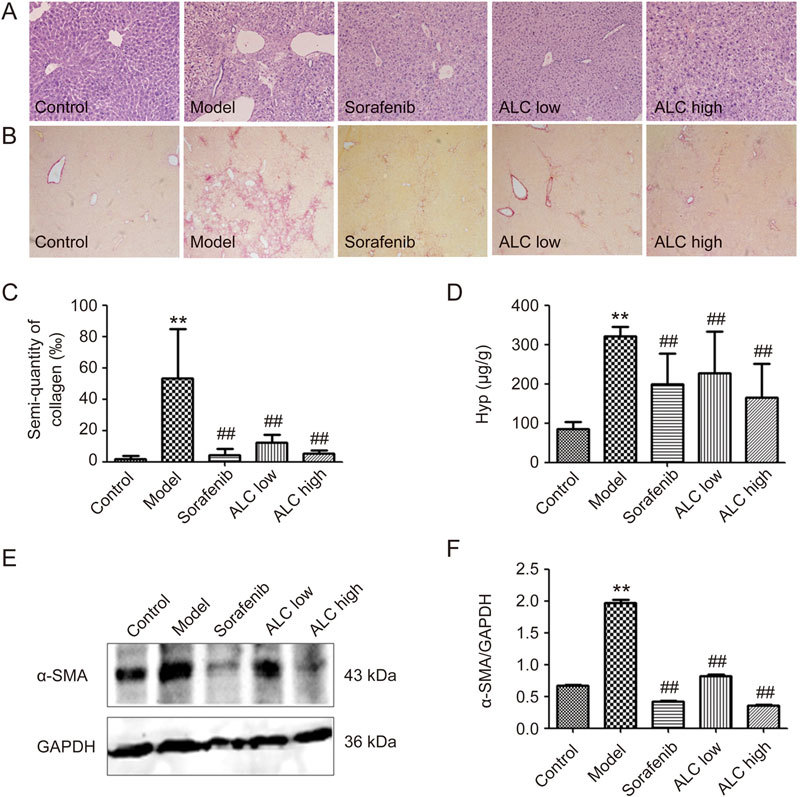
Figure 5.

ALC formula reduced collagen deposition and Hyp content in mice liver. (A) H&E staining, ×100. (B) Hepatic Sirius-Red staining, ×100. (C) Semi-quantitative analysis of hepatic collagen. (D) Assessment of hepatic Hyp. (E) Western blot analysis revealed α-SMA expression in mice liver. (F) Semi-quantitative analysis of α-SMA level. ** P<0.01 vs control group. ## P<0.01 vs model group.
