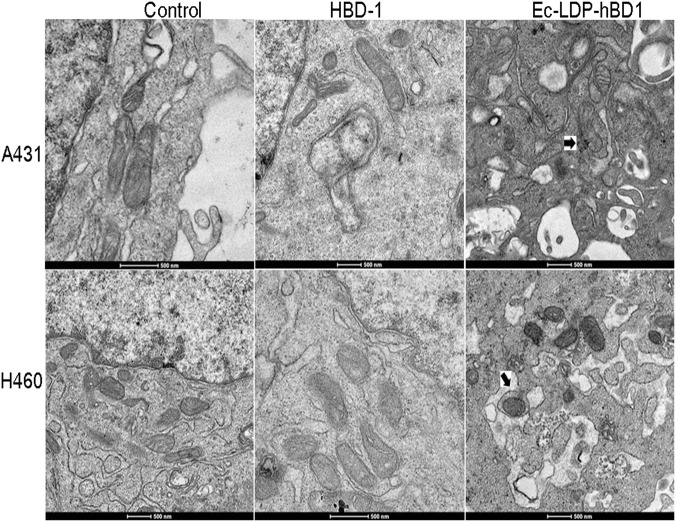
Fig. 6.
Effects of Ec-LDP-hBD1 on ultrastructure and mitochondrial membrane potential in human A431 and H460 carcinoma cells. Morphological observation with transmission electron microscopy in A431 and H460 cell treated with 5 μM Ec-LDP-hBD1 and the control. Upper row: scale bar, 2 μm; under row: scale bar, 500 nm. As shown, mitochondrial changes were found in the treated cells. The changes are indicated using arrows

