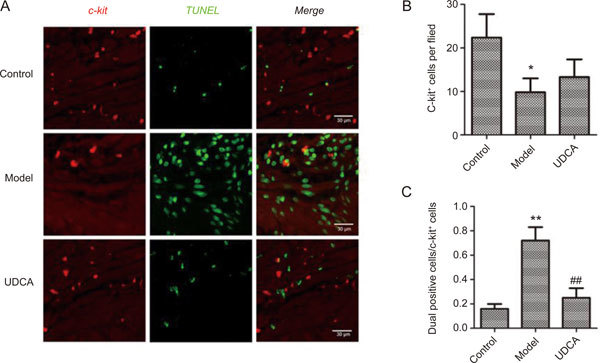
Figure 2.

(A) The representative co-localization images of control group, model group and UDCA group. (B) The number of c-kit positive cells in a single field in different groups. (C) The ratio of dual positive cells to c-kit positive cells in different groups. * P<0.05, ** P<0.01, control vs model; ## P<0.01, model vs UDCA.
