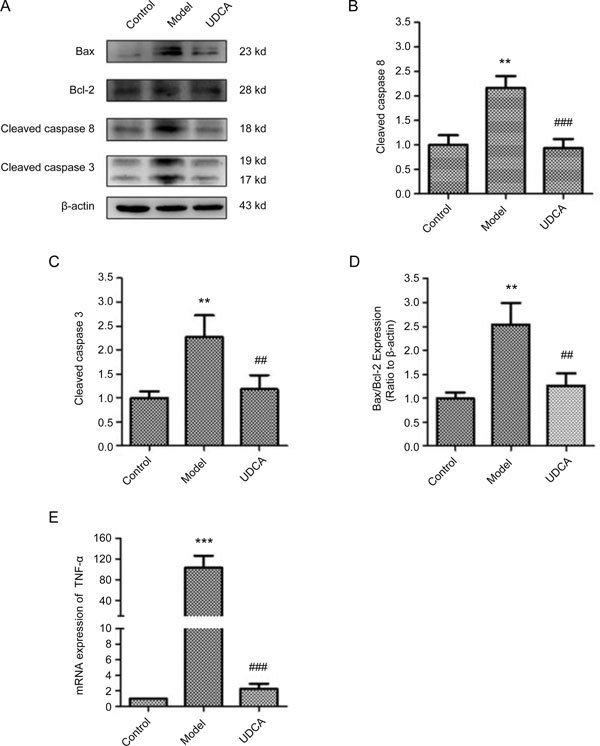
Figure 4.

(A) The Representative band images of Western blot. (B) Quantification of relative expression of cleaved Caspase8. (C) Quantification of relative expression of cleaved Caspase3. (D) Quantification of the intensities of Bax and Bcl-2 and expressed as Bax/Bacl-2 ratio. (E) The relative mRNA expression of TNF-α. ** P<0.01, *** P<0.001, control vs model; ## P<0.01, ### P<0.001, UDCA vs model.
