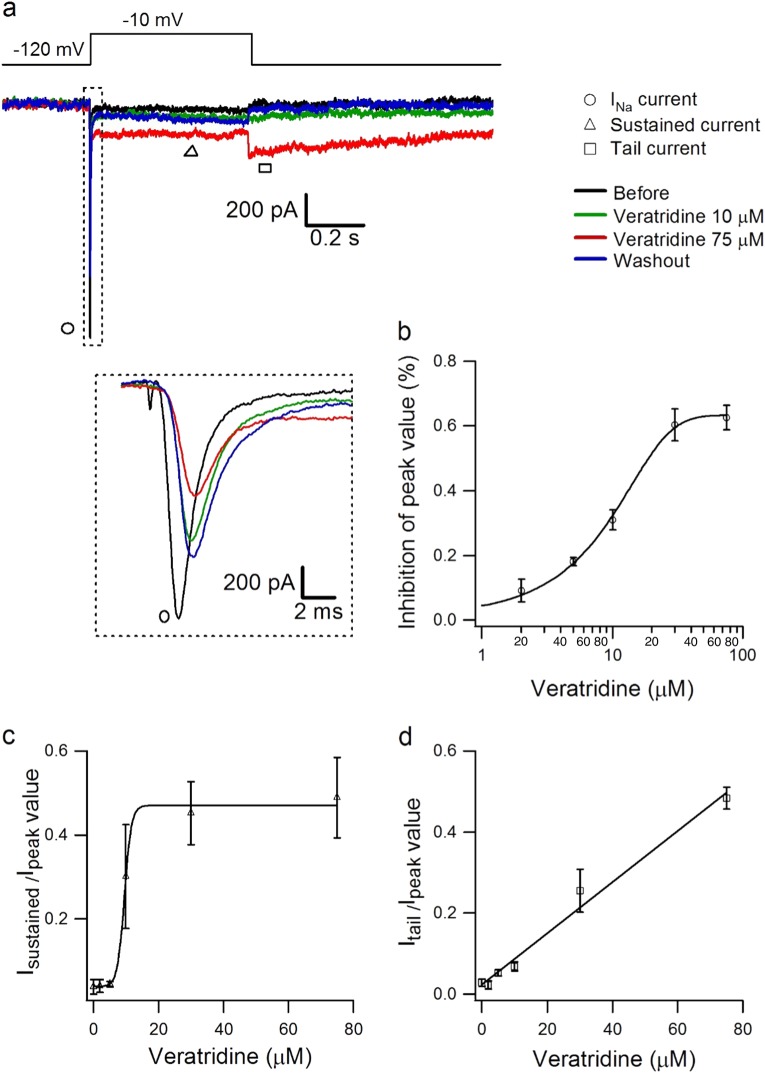
Fig. 1.
Dose-dependent effect of veratridine on Nav1.7 currents. a Typical traces showing the effect of veratridine (10 µM and 75 µM) on Nav1.7 peak current, sustained current, and tail current compared with the control condition (without veratridine) in the same cell, which was activated with 500 ms voltage steps between −80 and +20 mV in 5 mV increments from a holding potential of −100 mV at ~0.2 Hz. b–d Dose-dependent inhibitory effects of veratridine at 2–75 µM (n = 3 for each concentration) on the peak current (b), relative sustained current (c), and relative tail current (d) of Nav1.7; these values were normalized to the corresponding values from before veratridine and fitted with the equation y = base + max/[1 + exp(xhalf−x)k], where y is the Nav1.7 peak current, xhalf is the IC50 of veratridine, k is slope factor, and base and max are the minimum and maximum values of y

