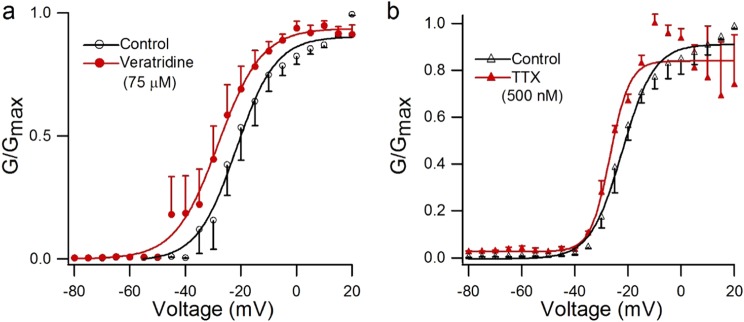
Fig. 3.
Steady-state activation curve modified by 500 nM TTX and 75 µM veratridine. Steady-state activation curve in the absence and presence of 75 µM veratridine (a, n = 5) or 500 nM TTX (b, n = 3). Cells were excited from a holding potential of −100 mV to the indicated voltage for 50 ms, and curves were fitted with the Boltzmann equation

