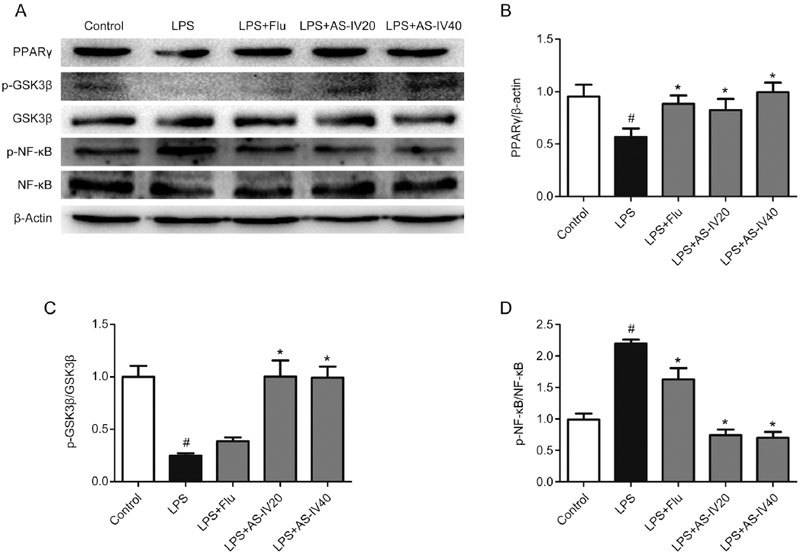
Figure 8.

Effect of AS-IV on PPARγ, p-GSK3β and p-NF-κB levels in LPS-induced mice. All values are expressed as the mean±SEM (n=3). # P<0.05 compared to the Control group; * P<0.05 compared to the LPS group. (B) PPARγ level. (C) p-GSK3β level. (D) p-NF-κB level.
