
Figure 10.
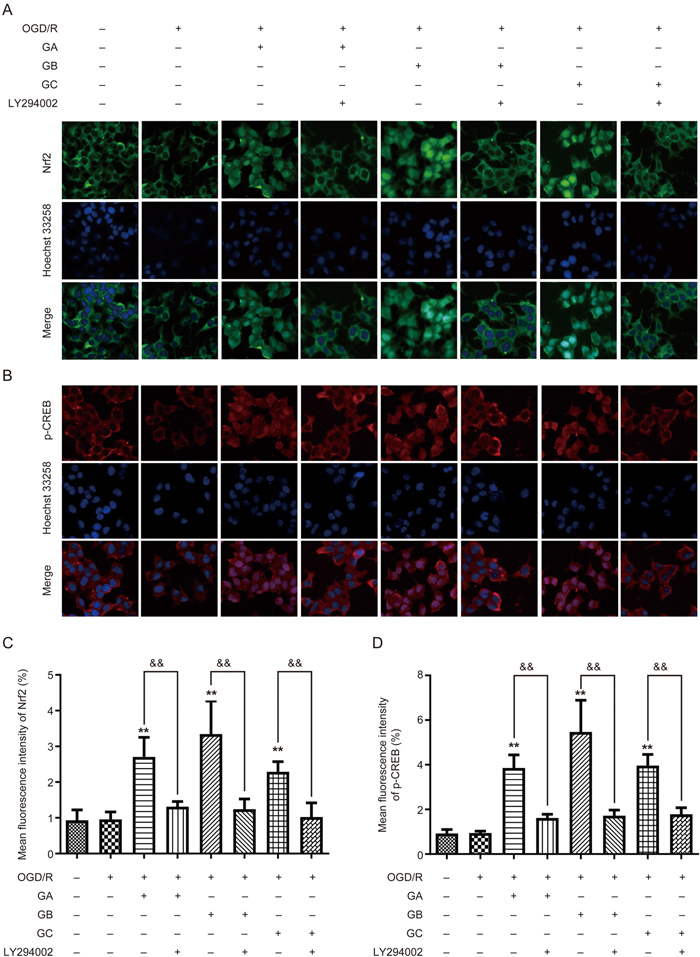
Effects of Ginkgolide A, B and C on Nrf2 and p-CREB levels. (A) Expression of Nrf2 (green fluorescence) was assessed by immunofluorescence in PC12 cells. (B) Expression of p-CREB (red fluorescence) was assessed by immunofluorescence in PC12 cells. (C) Mean fluorescence intensity of Nrf2 (n=5). (D) Mean fluorescence intensity of p-CREB (n=5). ** P<0.01 compared to the model group. && P<0.01 compared to the related group linked by lines.