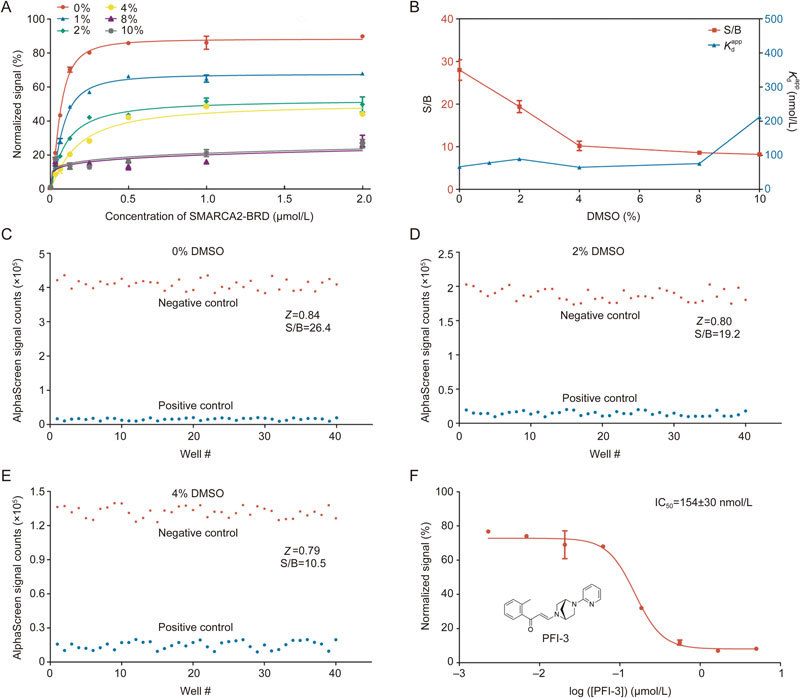
Figure 2.

Evaluation of DMSO tolerance in the optimized AlphaScreen binding assay. (A) AlphaScreen saturation binding curves in the absence or presence of different DMSO concentrations. (B) Signal-background ratio and apparent K d values at different DMSO concentrations. (C–E) Evaluation of Z' factors for the AlphaScreen high-throughput screening assay in the absence or presence of 0%, 2%, and 4% DMSO. The AlphaScreen normalized signals from both negative and positive controls are shown in a scatter plot. (F) IC50 curve for PFI-3. All experiments were performed at least three times. The data were analyzed in GraphPad Prism 5.0.
