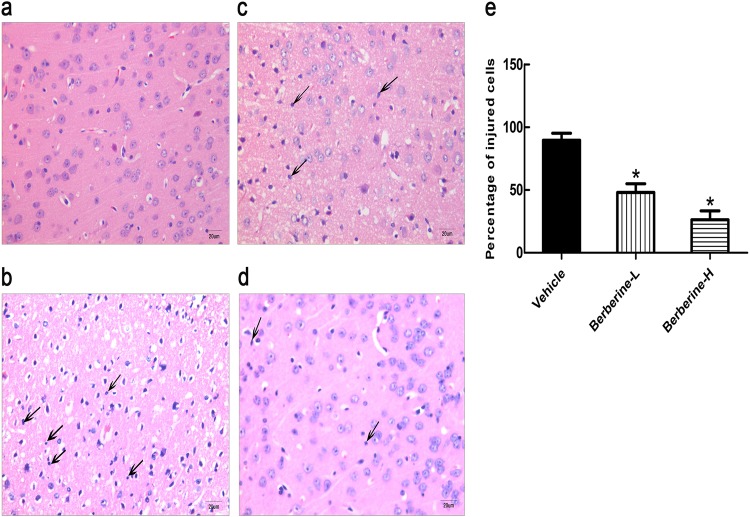
Fig. 4.
Representative images of ischemic brain tissue with hematoxylin and eosin staining (n = 3). Scale bar, 20 µm. Magnification of the microphotograph, × 400. Arrows indicate injured cells in the ischemic cortex region. a Sham group, b vehicle group, c berberine-L group, d berberine-H group. e Percentage of injured cells in the vehicle, berberine-L, and berberine-H groups in the cerebral cortex. Data are presented as the mean ± SD. *P < 0.01 versus the vehicle group

