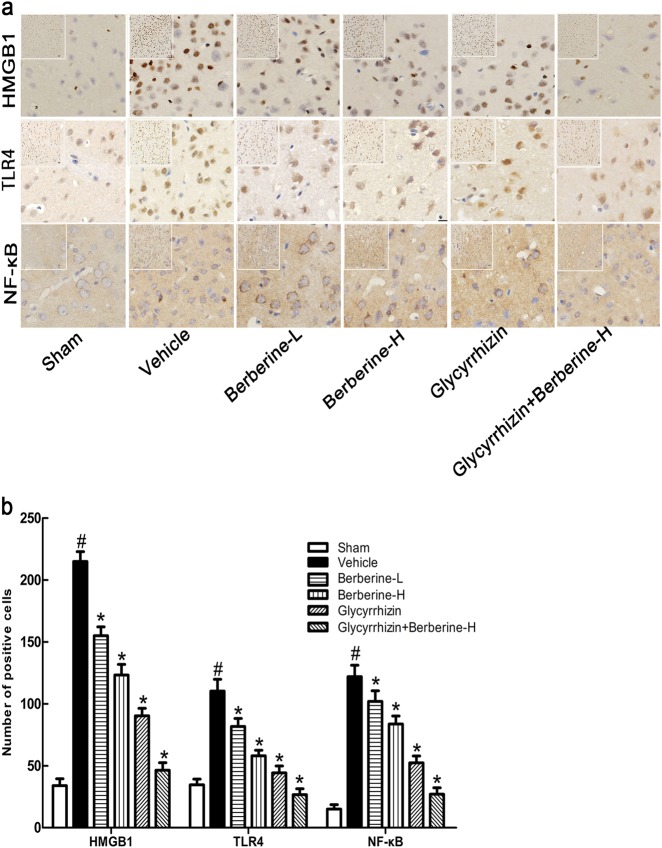
Fig. 6.
a Enlarged images from representative immunohistochemistry photographs of HMGB1, TLR4, and NF-κB in different groups (n = 3). The original images were placed on the top left corner of each photograph. Scale bar, 20 µm. Magnification of the microphotograph, × 400. b Number of cells with positive staining for HMGB1, TLR4, and NF-κB. Data are presented as the mean ± SD. #P < 0.01 versus the sham group; *P < 0.01 versus the vehicle group

