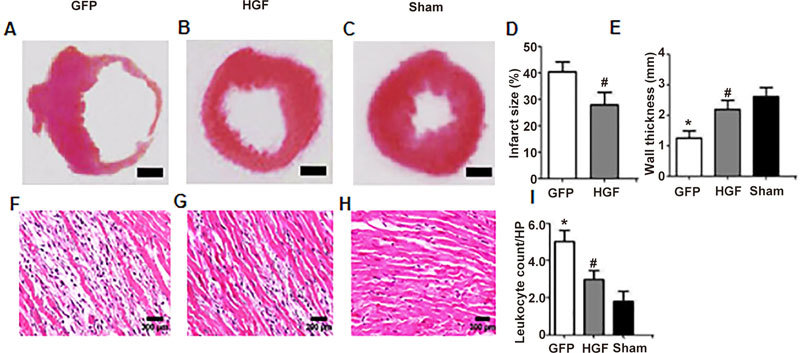
Figure 3.

Cardiac morphology and hematoxylin and eosin staining 4 weeks after treatment. Cardiac morphological changes in the GFP group (A), HGF group (B) and sham group (C) (H&E staining, Scale bar=1 mm). HGF markedly reduced the infarct size (D) and increased the wall thickness (E). Representative photomicrographs of H&E staining (F, G and H; ×100). The number of infiltrated lymphocytes significantly decreased in the HGF group compared to the Ad-GFP group (I). Values are means±SD. n=8/group. * P<0.05 vs sham group. # P<0.05 vs GFP group.
