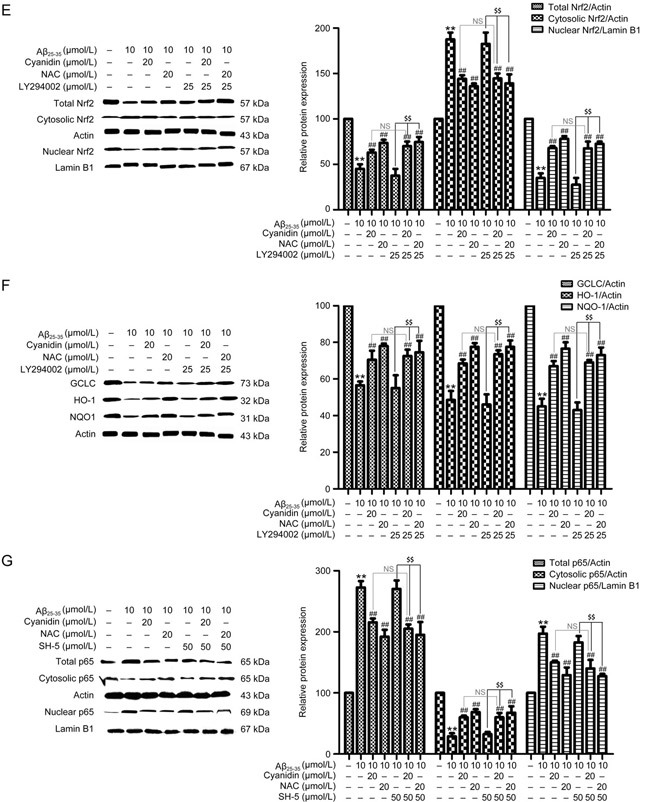
Figure 3E-G.

Western blotting analysis was performed to measure the total, cytosolic, and nuclear protein levels of Nrf2 (E), HO-1, NQO-1, and GCLC (F). The SK-N-SH cells were pretreated with 50 μmol/L SH-5 for 1 h; preincubation was carried out with cyanidin (20 μmol/L) or NAC (20 μmol/L) for 2 h, and the cells were exposed to Aβ25-35 (10 μmol/L) for another 24 h. Western blotting analysis was performed to measure the total, cytosolic, and nuclear protein levels of p65 (G). The data are expressed as the mean±SEM (n=3). ** P<0.01 vs the control. # P<0.05, ## P<0.01 vs the Aβ25-35-treated group. $$ P<0.01 vs the Aβ25-35-plus-inhibitor-treated group.
