Figure 2.

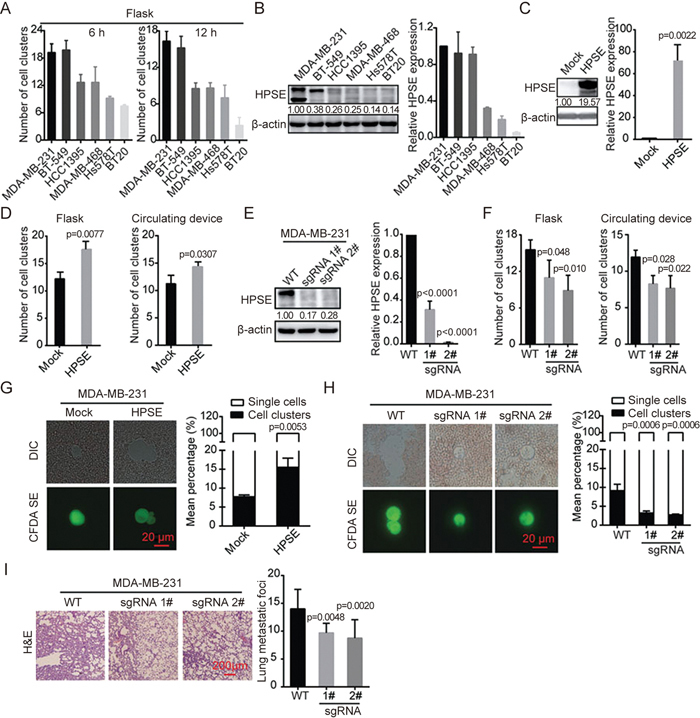
Heparanase promotes the formation of cell clusters and contributes to their metastatic potential. (A) Bar graph showing the number of cell clusters formed by six TNBC cell lines in suspended culture for 6 h or 12 h using flasks. (B) Heparanase expression was detected by immunoblotting and RT-PCR in different TNBC cell lines. Densitometric data (fold) were shown. (C) Immunoblotting and quantitative RT-PCR analysis of heparanase levels in MDA-MB-231 transfected with mock or heparanase-overexpression plasmid. Densitometric data (fold) were shown. (D) Histogram showing the number of heparanase-overexpressing MDA-MB-231 cell clusters in suspended culture for 12 h using flasks and a circulating device respectively. (E) Immunoblotting and quantitative RT-PCR analysis of heparanase knockout in MDA-MB-231 cells using CRISPR/Cas9 technology. Densitometric data (fold) were shown. (F) Histogram showing the number of heparanase-depleted MDA-MB-231 cell clusters in suspended culture for 12 h using flasks and a circulating device respectively. (G) Representative images of tumor cells from blood using fluorescence and DIC microscopy. Histogram showing the mean percentage of single cells or cell clusters in the groups transfected with mock or heparanase-overexpression plasmid. (H) Representative images of tumor cells from blood captured by fluorescence and DIC microscopy. Bar graph shows the percentage of single cells or cell clusters in the WT and heparanase-knockout groups. (I) Representative images of H&E-stained sections of mouse lungs in the WT and heparanase-knockout groups. Histogram showing the number of lung metastatic foci (n=6). Values are expressed as the mean±SD. Two tail student's t-test analysis was used to compare the statistical difference between indicated two groups in (C), (D), and (G). One-way ANOVA was applied in experiments containing multiple groups in (E), (F), (H), and (I).
