
Figure 2.
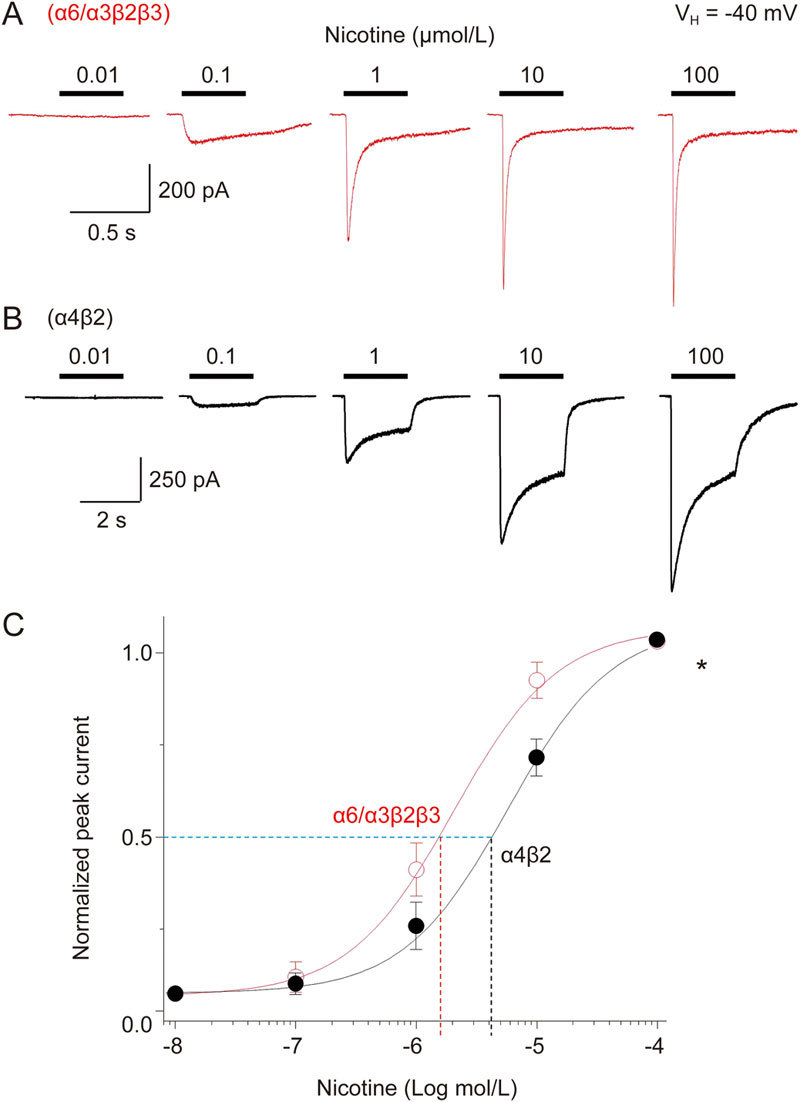
Nicotine concentration-response relationships for α6*-nAChR-mediated whole-cell current in SH-EP1 cells. Five typical whole-cell current traces elicited in response to nicotine exposure (0.01–100 μmol/L) are shown for cells expressing either α6*-nAChR (A) or α4β2-nAChR (B). (C) Nicotine concentration-response curves plotted for peak currents normalized to those evoked in response to 100 μmol/L nicotine show differences at α6*-nAChRs and α4β2-nAChRs in agonist potency. Each symbol represents the average from 10–12 cells, and vertical bars represent standard errors.