
Figure 3.
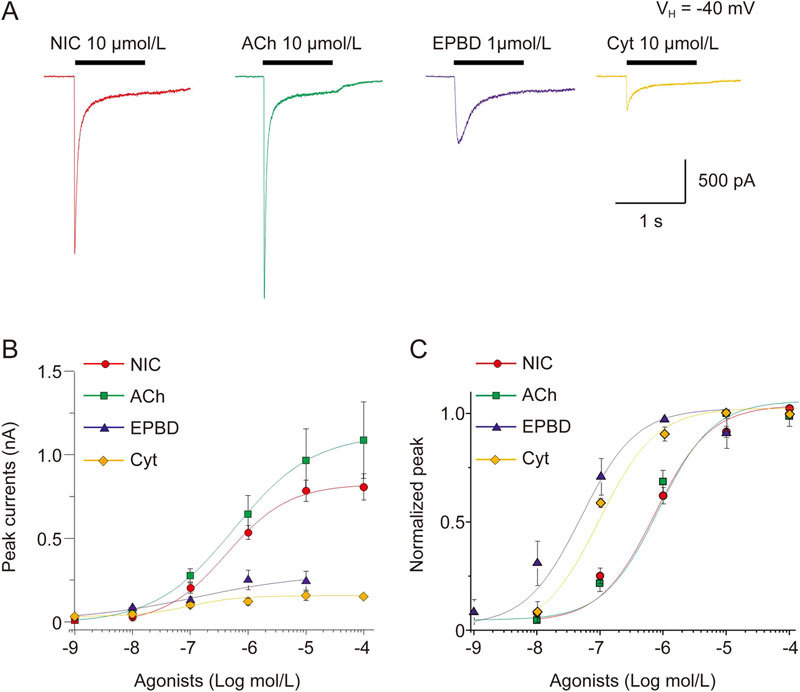
Concentration-response curves for NIC, ACh, epibatidine (EPBD) and cytisine acting at α6*-nAChR. (A) Representative traces showing α6*-nAChR-mediated whole-cell currents elicited by select nAChR agonists nicotine (NIC), ACh, EPBD, and cytisine. (B) Peak current amplitudes of α6*-nAChR evoked by NIC, ACh, EPBD and cytisine are plotted to the real current peak current amplitudes, and show the different efficacy of these nAChR agonists tested. (C) α6*-nAChR-mediated whole-cell currents responses evoked by those agonists were normalized to their maximal response. Each symbol represents the average from 6-8 cells tested, and vertical bars represent standard errors.