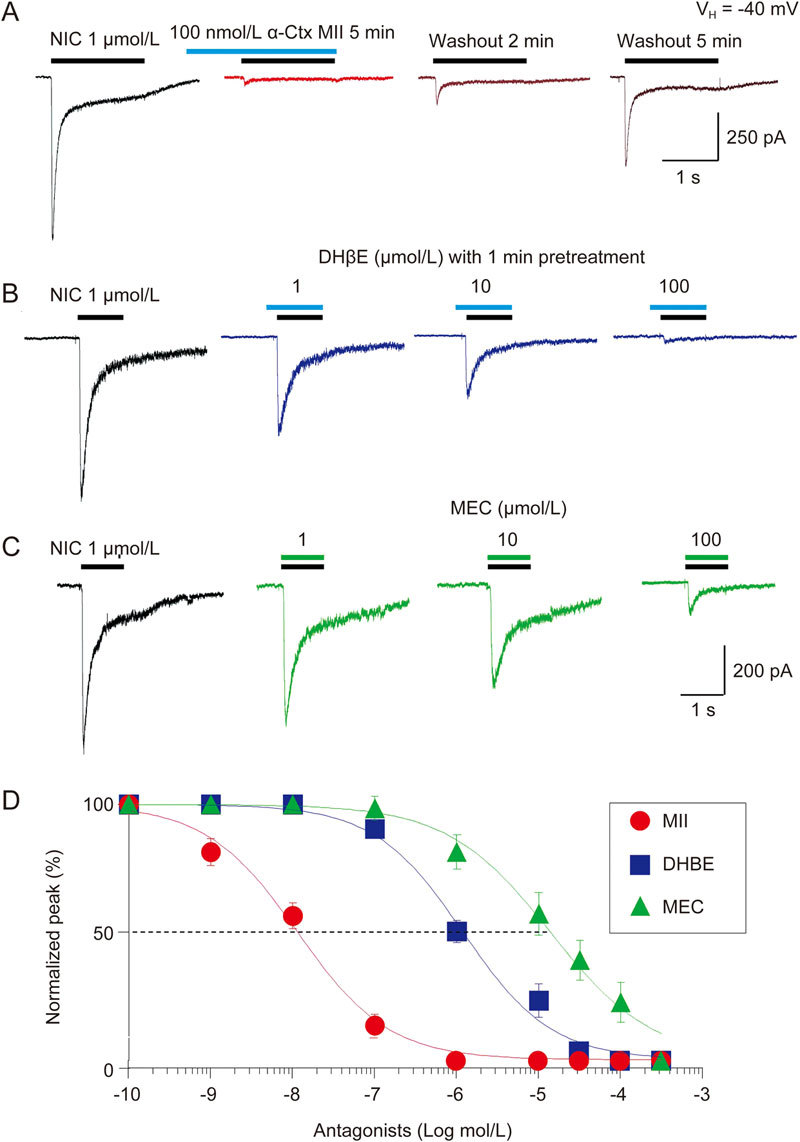
Figure 4.

Effects of α6*-nAChR antagonists. Representative typical traces showing antagonism of α6*-nAChR-mediated currents (induced by 1 μmol/L NIC) by the α-Ctx MII (100 nmol/L with 5-min pretreatment (A), the DHβE (0.1, 1, 10 μmol/L with 1-min pretreatment (B), and the MEC (1, 30, 300 μmol/L without pretreatment (C). After washout for 5 min, the inhibition by α-Ctx MII can be partially recovered (A). (D) three nAChR antagonists, α-Ctx MII, DHβE and MEC are superimposed and are plotted as concentration-response curves. Each symbol represents the average from 6–8 cells, and vertical bars represent standard errors.
